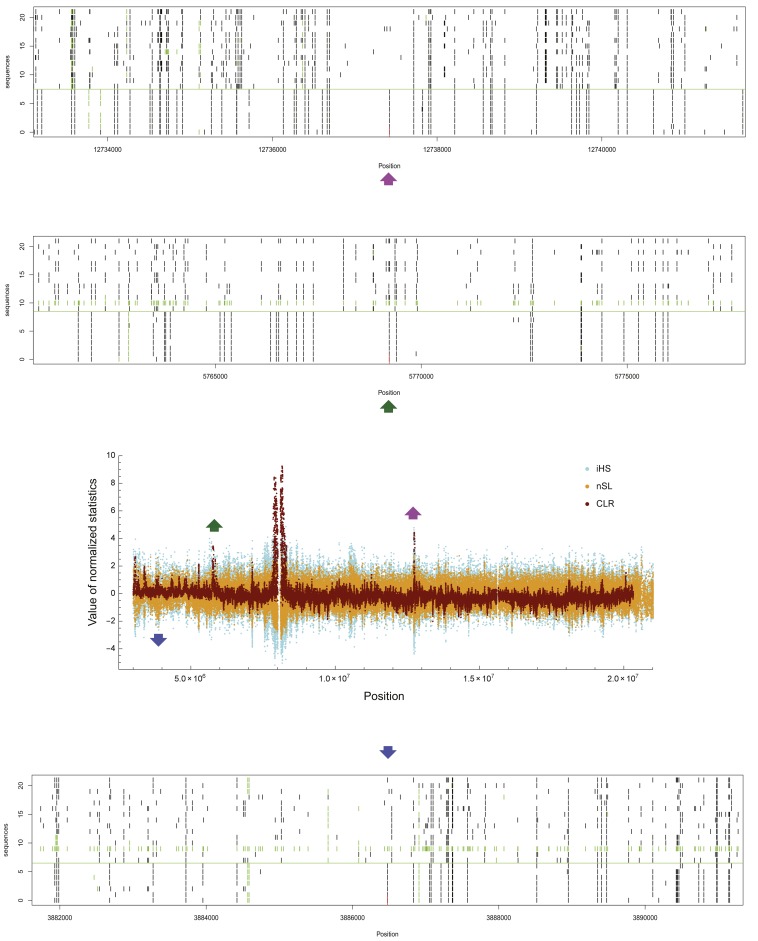
Figure 5.
Plots of normalized maximum-composite-likelihood ratio (T1x; dark red) and standardized iHS (light blue) and nSL (orange) along chromosome 2R. Haplotype structures around three putative positions under selection (positions 5,769,223 and 12,737,423 detected by the CLR method and position 3,886,479 detected by the nSL method) are shown. Aligned sequences were sorted by the position of the putative site, with those carrying ancestral alleles on the top and derived alleles on the bottom (divided by a horizontal green line). Derived alleles and missing base calls at polymorphic sites are marked by black and green bars, respectively.

