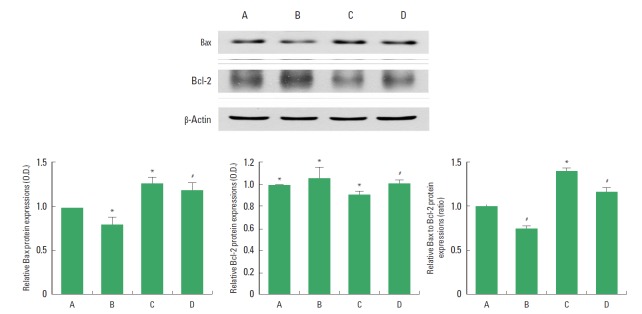
Fig. 4.

Effect of treadmill exercise on the Bax and Bcl-2 expressions in the hippocampus. Upper: Western blot analysis of Bax and Bcl-2 in the hippocampus. Left: The optical density of Bax expression in each group. Middle: The optical density of Bcl-2 expression in each group. Right: The Bax/Bcl-2 ratio in each group. (A) Sham-operation group, (B) sham-operation and treadmill exercise group, (C) Huntington’s disease-induced group, (D) Huntington’s disease-induced and treadmill exercise group. *represents P<0.05 compared to the sham-operation group. #represents P<0.05 compared to the Huntington’s disease-induced group. The data are expressed as the mean±standard error of the mean (SEM).
