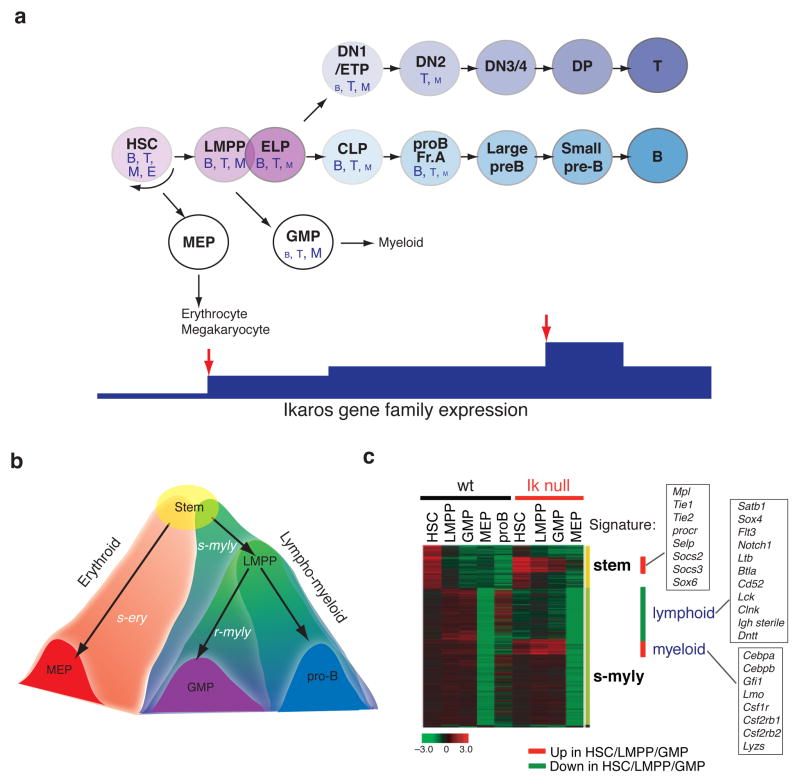
Figure 2. Cellular and transcriptional hierarchies in early hematopoiesis.
(a) The lineage potential of each progenitor in the hematopoietic hierarchy is denoted by letter size. B, B cells; T, T cells; E, erythroid; M, myeloid. Relative changes in Ikaros expression in this developmental hierarchy is shown at the bottom. Red arrows indicate critical stages where Ikaros family proteins are up-regulated. (b) The two cascades of lineage specific gene programs that originate in the multi-potent HSC and segregate within the erythroid and lympho-myeloid, pathways are shown. The early lympho-myeloid cascade is comprised of two layers of gene expression, the s-myly is primed in the HSC and further induced in the LMPP and downstream progeny whereas r-myly is primed in the LMPP. In sharp contrast, only one layer is seen in the early erythroid cascade reflecting a lack of progressive lineage restriction points. (c) Effects of Ikaros deficiency on the stem and s-myly signatures. A heatmap of gene expression of the s-myly and stem cell signatures in the HSC, LMPP, GMP, MEP and proB from WT and Ikaros null mice is shown. The signature designation is provided on the right side. The red bars indicate the up-regulated genes and the green bar indicates the down-regulated genes upon loss of Ikaros. The leg of the s-myly signature that is down-regulated is highly enriched for lymphoid promoting genes, whereas the middle section of the s-myly signature that is up-regulated is highly enriched for myeloid promoting growth factors and transcription regulators. Examples of the deregulated genes are provided in each box.

