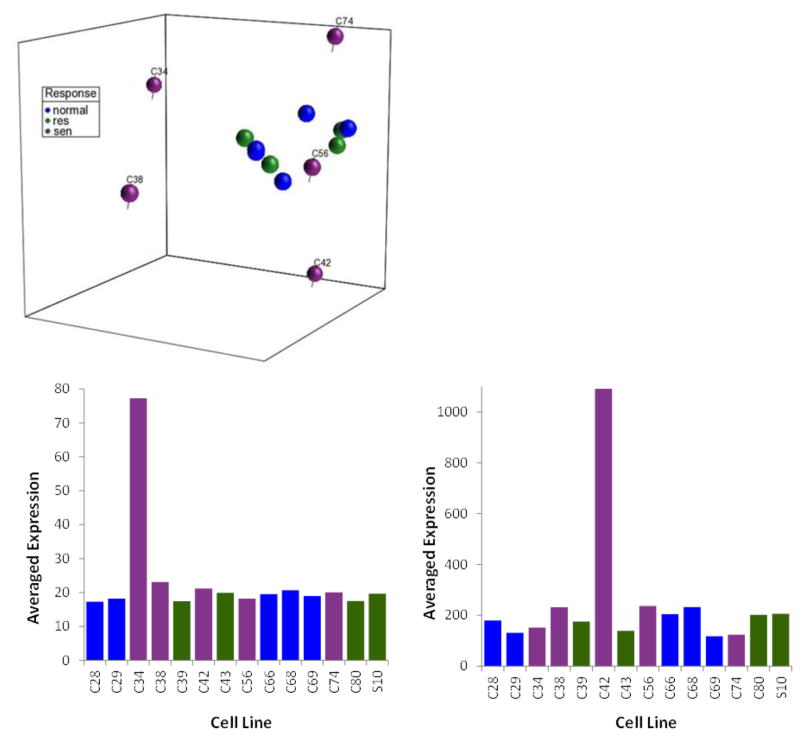
Fig. 4.
(Top) Principal component analysis of gene expression in 14 representative fibroblast cell lines. A false discovery rate of 0.01 was used to restrict the number of genes used in the principal component analysis. (Bottom) Correlations were measured between the component for each gene from the whole genome and the projection of C34 or C42 against each principal component. The adjusted p value of less than 0.01 was considered as significantly correlated after a Bonferroni multiple testing correction. Genes correlated with the PCA patterns (138 genes in C34 and 38 genes in C42) exhibited low expression levels in the corresponding cell lines.

