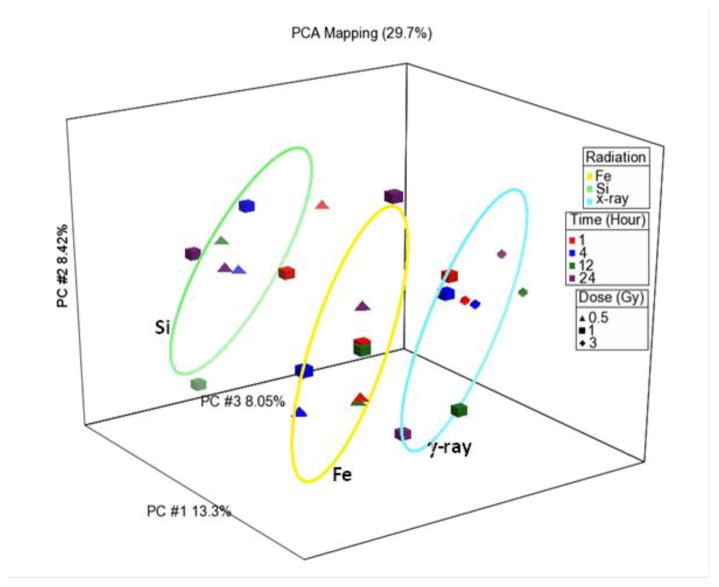
Fig. 7.
Principal component analysis of gene expression using the differences in gene expression for all genes when compared to unirradiated controls, for gamma ray, silicon, or iron (1 Gev μm−1). There are three independent replicates for each data point. The ellipses were generated by measuring three standard deviations around the centroid for each group using Partek Genomics Suite.

