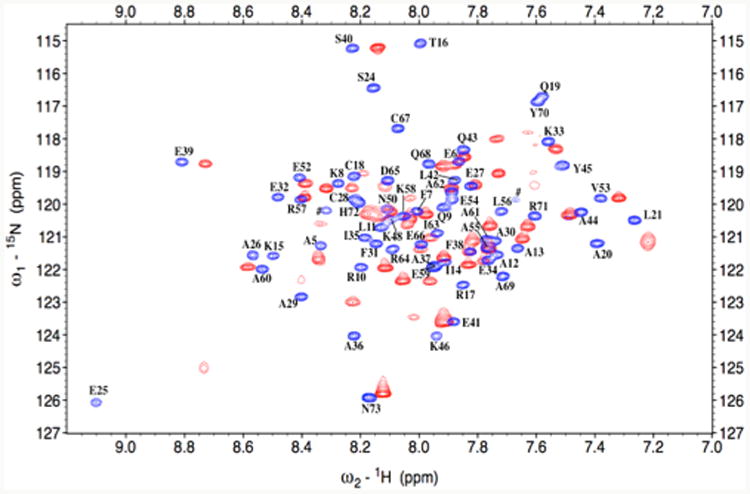
Figure 3.

Enlargement of the N-HSQC spectra of apo α3DIV (blue) and Pb(II)-α3DIV (red), both at pH 7.0. Spectra were collected on a 500 MHz Bruker Avance NMR spectrometer at 25 °C. The assignments in the apo spectrum are adjacent to their corresponding peak. In this view, the apo spectrum displays 63 of 68 assigned peaks, while the Pb spectrum α3DIV shows 54 of its 68 expected peaks.
