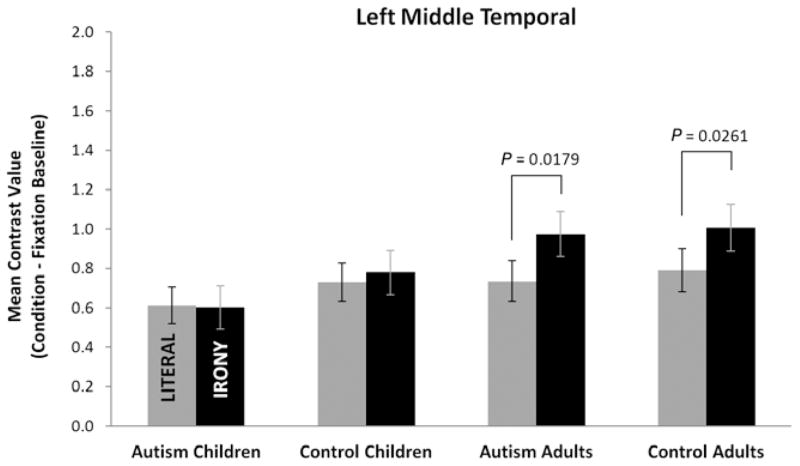
Figure 4.
Mean contrast values (activation during the literal or irony conditions minus activation during fixation) for the four groups for the left middle temporal region demonstrating reliably higher activation in the adult groups than in the child groups for the irony condition. Unlike the adults, neither of the child groups had a reliable increase in activation during the irony condition. Values are least-squares means adjusted for the behavioral covariates in the mixed model. Error bars are the standard errors of these least-squares mean estimates.

