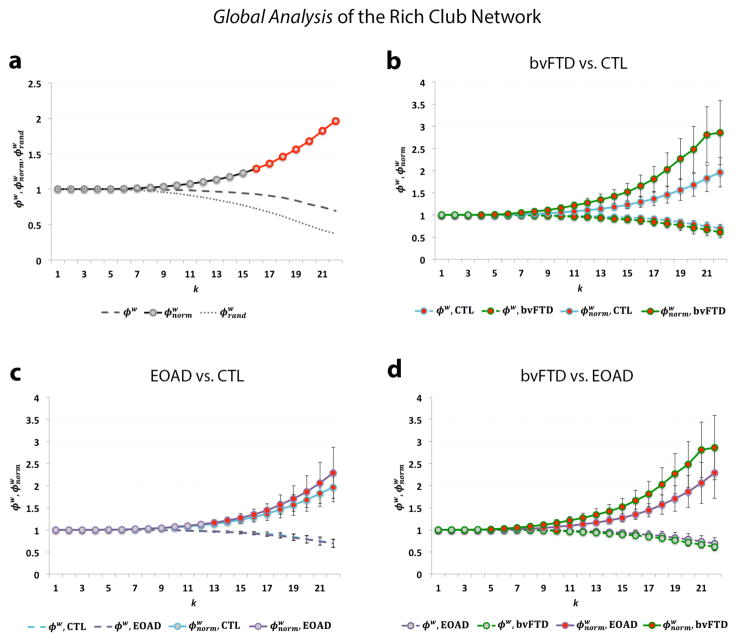
Fig. 2.
(a) Shows the rich club curves, including the unnormalized (ϕw), normalized ( ) and randomized rich club ( ) as a function of nodal degree, k, for the weighted group average networks in healthy controls; a rich club is formed at k>15. (b) Shows significant differences (red) in the normalized (FDR critical p-value=0.016) and unnormalized rich club coefficient (FDR critical p-value=0.010) between bvFTD (green) and controls (blue) across most of the k-value regime. (c) Shows significant differences in the normalized (FDR critical p-value<0.016) rich club coefficient between EOAD (purple) and controls mostly in the high-level k-value regime. (d) Shows significant differences in the normalized (FDR critical p-value=0.016) and unnormalized rich club coefficient (FDR p-value=5×10⁻⁴) between bvFTD and EOAD participants. Gray dots on the curves indicate that no differences were detected. Error bars indicate standard error.

