
Figure 2.
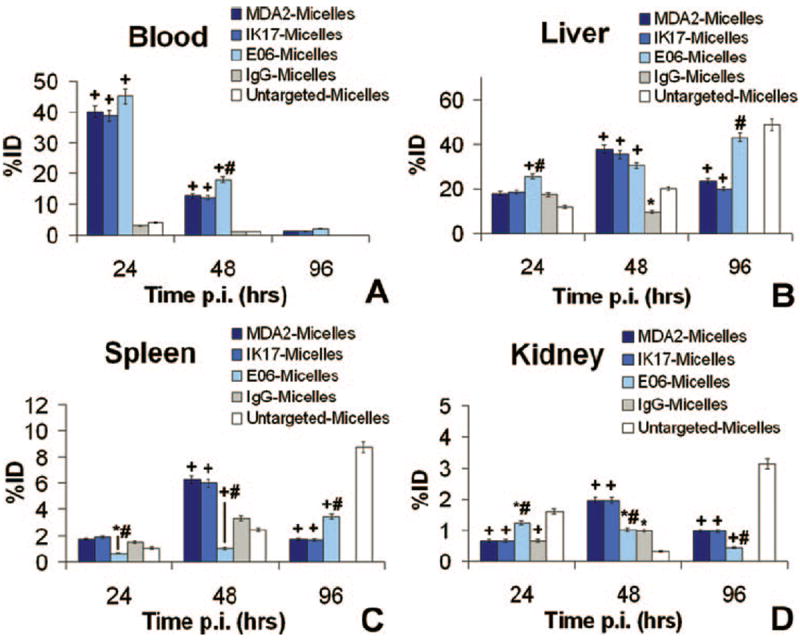
Biodistribution of MDA2, IK17, E06, IgG, and untargeted micelles (0.075–mmol Gd/kg dose) at 24, 48, and 98 hours after injection (p.i.) in apoE−/− mice. The %ID in blood (A), liver (B), kidney (C), and spleen (D). +P<0.001, *P<0.05, differences between MDA2, IK17, E06, and IgG micelle and untargeted micelles at each time point. #P<0.05, differences between MDA2, IK17, and E06 micelles at each time point.