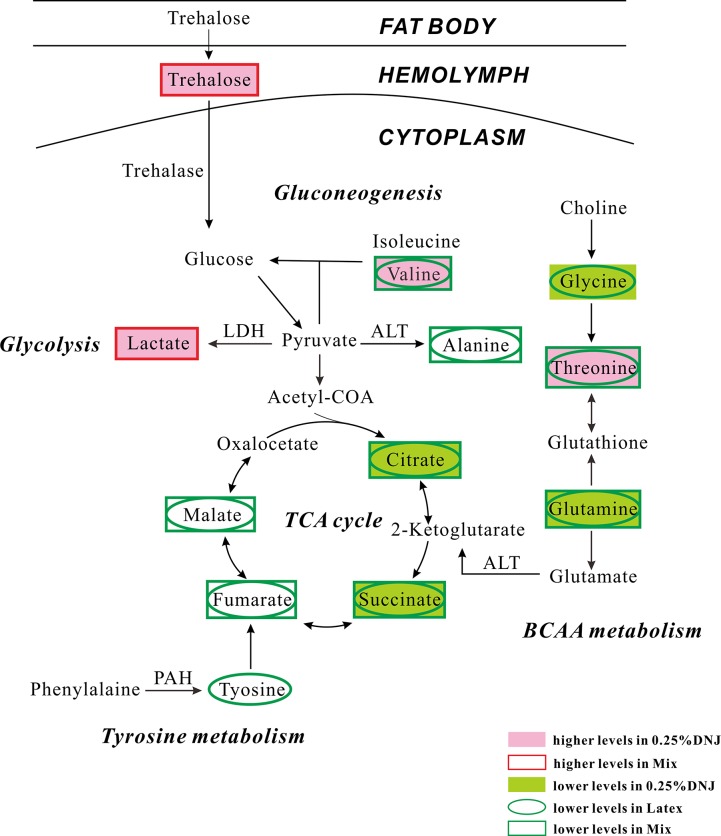
Fig 5. Schematic diagram of the metabolic pathways.
The metabolite changes detected by 1H NMR hemolymph analysis and the pathway referenced to the KEGG database show the interrelationship of the identified metabolic pathways involved in the experimental Eri silkworms. Metabolites with increased and decreased levels compared to control silkworms are indicated in red and blue.

