
Fig. 7.
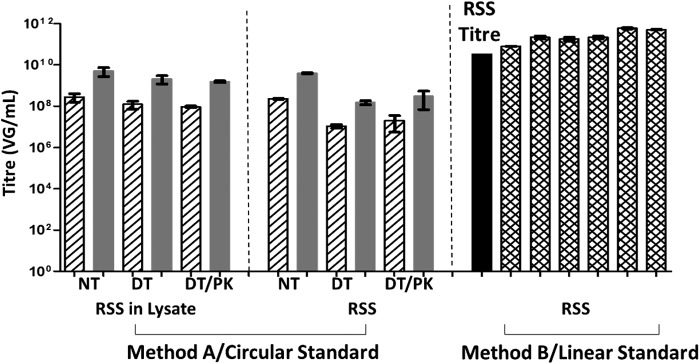
qPCR analysis of artificial crude (left) and pure (middle and right) ATCC reference materials (RSS) prepared by method A (left and middle) or method B (right), quantified on the basis of calibration curves of circular (left and middle) or linearized (right) plasmid DNA in H2O (hatched and cross-hatched columns) or DT/PK mixture (gray columns). The RSS given titer (3.28×10¹⁰ VG/ml) is shown in the solid column. Data for each column represent mean data of nine PCRs of the same sample prepared in triplicate and then qPCR in triplicate (n=9). All study results are significantly different from the RSS given titers of 3.28×10¹⁰ VG/ml, p<0.05.