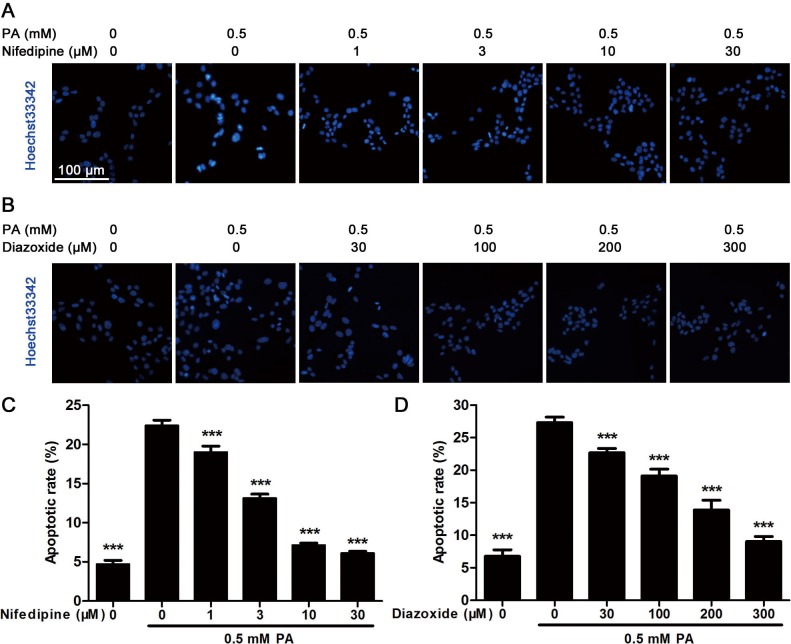
Fig 2. Hoechst33342 staining analysis in MIN6 cells.
(A) After the cells were treated with 0.5 mM PA in the presence/absence of nifedipine at indicated concentrations for 48 h, Hoechst33342 staining was performed to detect apoptotic cells. Blue fluorescence indicated all nucleus, the lighter and shrinkage dots were apoptotic cells. Scale bar = 100 μm and referred to all panels. (B) After the cells were treated with 0.5 mM PA in the presence/absence of diazoxide for 48 h, Hoechst33342 staining was performed. (C)(D) The apoptotic rate was calculated as apoptotic cell number divided by total cell number. 10 random sights in each well were selected to count apoptosis, and the data from six duplicated wells were analyzed (n = 6). *** p<0.001 denote significant difference versus the PA-treated alone group.

