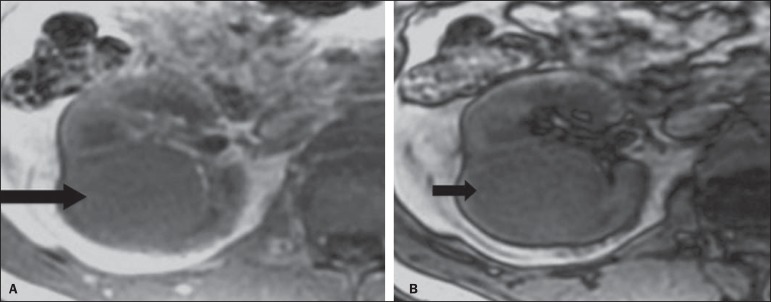
Figure 3.
Clear cell RCC variant. MRI with the chemical shift imaging technique. In phase (A) and out of phase (B) images showing expansile, solid lesion in the right kidney (arrows) presenting with subtle signal loss in the out of phase sequence, that is difficult to be visualized, characterized only by the signal intensity loss índex corresponding to 11% (signal intensity loss index = in phase signal intensity – out of phase signal intensity / in phase signal intensity × 100).

