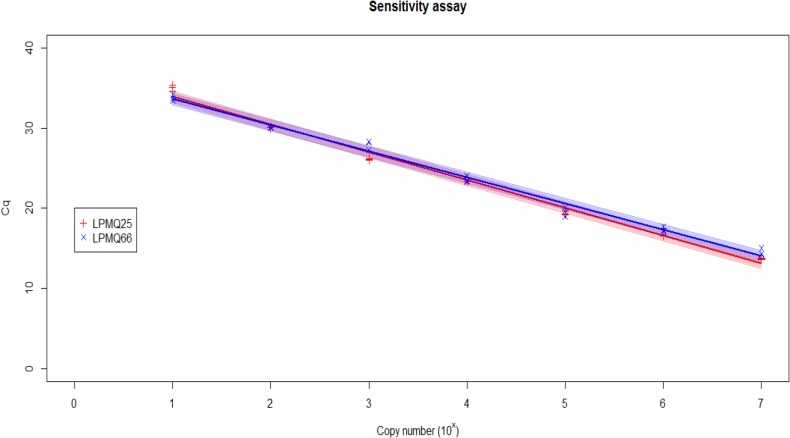
Fig 1. Sensitivity test of the real-time PCR assay for the identification of T. urticae.
Plasmid containing ITS1 insert of T. urticae were series diluted to create calibration curves for sensitivity calculations. The standard curve built from Cq values against the log copy number (range = 107–10 copies) of ITS1 insert (n = 3). The 95% confidence intervals of the slopes were plotted with a blue line for LPMQ66 and a red line for LPMQ25. The r 2 = 0.993 for LPMQ66 and 0.990 for LPMQ25 were obtained for the assay.

