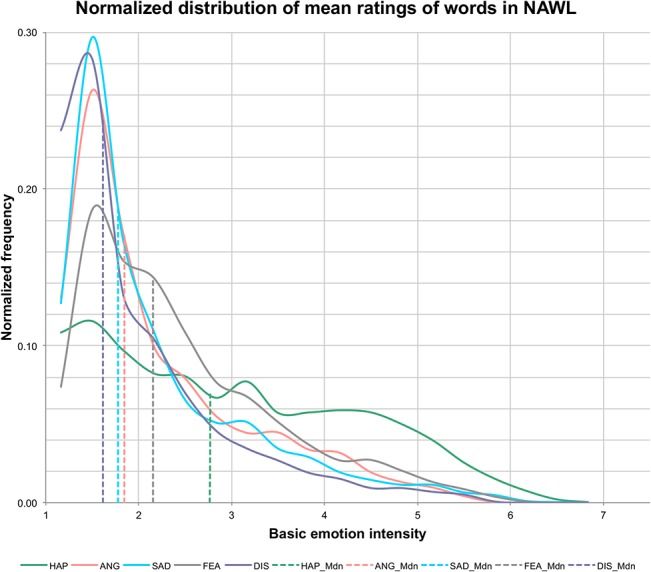
Fig 1. Normalized frequency distribution of mean ratings for the basic emotions included in the NAWL (n = 2902).

Dotted lines represent median values of the respective distributions.

Dotted lines represent median values of the respective distributions.