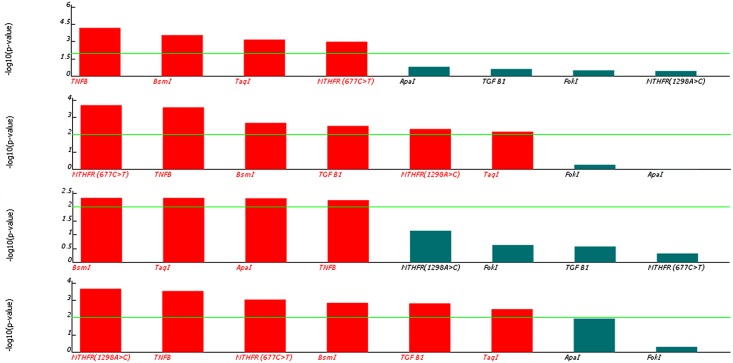
Fig 2. Association Analyses for Examined SNPs with RA Disease.
(a) Multiplicative model. (b) Dominant model. (c) Recessive model. (d) Co-dominant model. The horizontal line in each model represents the significance level of the P value (0.01). The figure was generated using the SNPAnalyzer 2.0 program.

