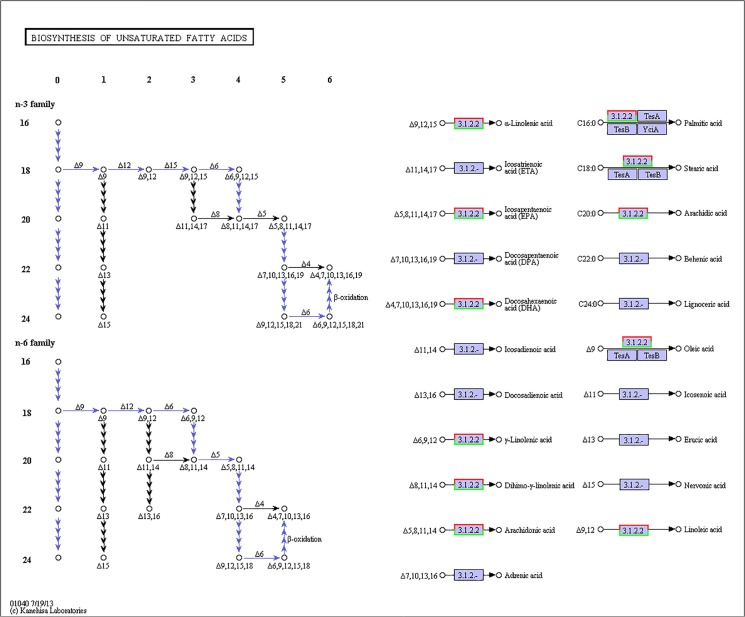
Fig 5. Pathways of unsaturated fatty acid biosynthesis (ko01040).
The red frames represent the genes were up-regulated, while the green frames represent that the genes were down-regulated. The frames with both red and green indicate that these genes had more than one unigenes, and some of them were up-regulated, but others were down-regulated.

