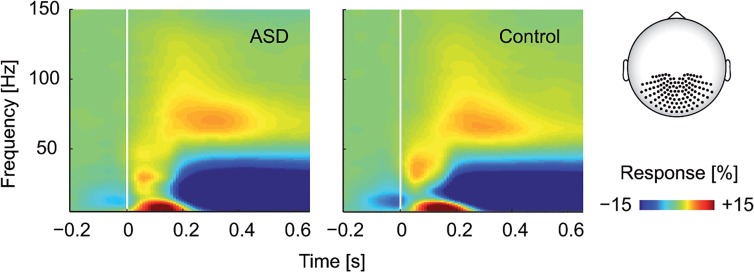
Fig 2. Time-frequency representation.
The MEG signal was averaged across posterior sensors (highlighted on the schematic head) and all levels of motion coherence, for both groups (left: ASD, right: Control). All responses were quantified as the percentage of change in signal amplitude relative to a blank prestimulus baseline interval (400 ms before up to stimulus onset).

