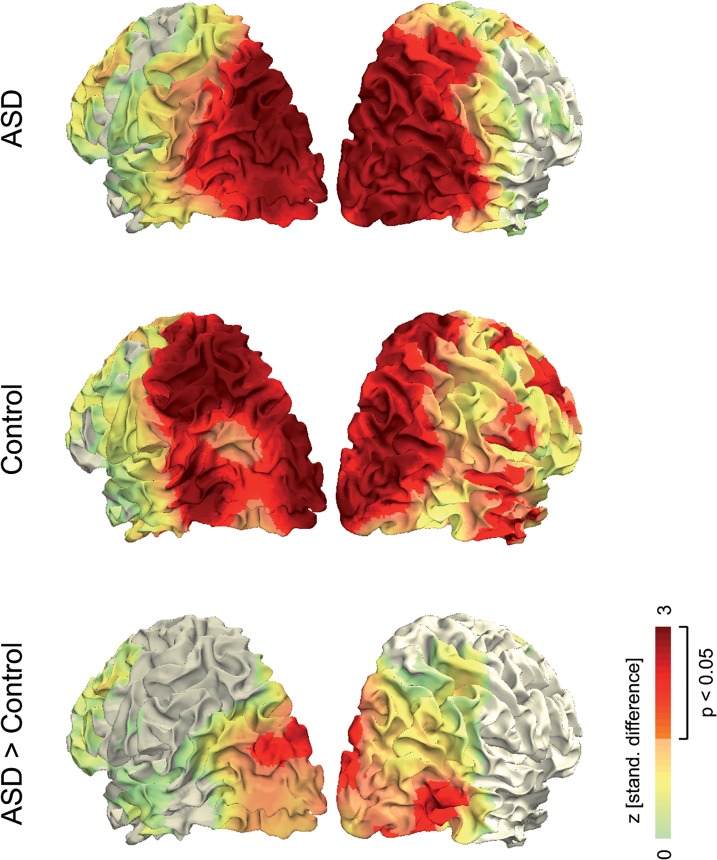
Fig 4. Functional overlays of linear modulation by visual motion strength.
Data were averaged across time points (150–350 ms after stimulus onset) and frequencies (60–80 Hz). Projection on a standard MNI cortical surface was performed by weighting the distance between every voxel in the functional data to each surface point on the cortex. Colors represent positive z-values, while negative z-values are not shown (gray color).

