
Figure 1.
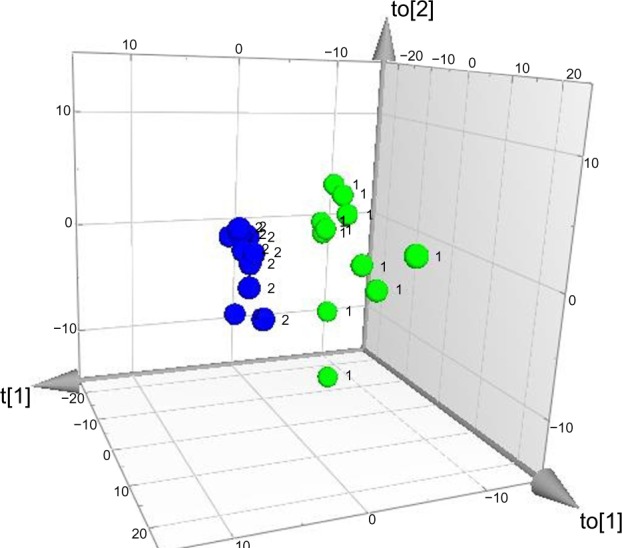
Three-dimensional score plot of group membership orthogonal partial least squares – discriminant analysis.
Notes: Class separation between patients (n=11, green dots marked by [1]) and healthy controls (n=11, blue dots marked by [2]) occurs along the t[1] axis (inter-class variation), whereas the other two axes (to[1] and to[2]) represent intra-class variation.