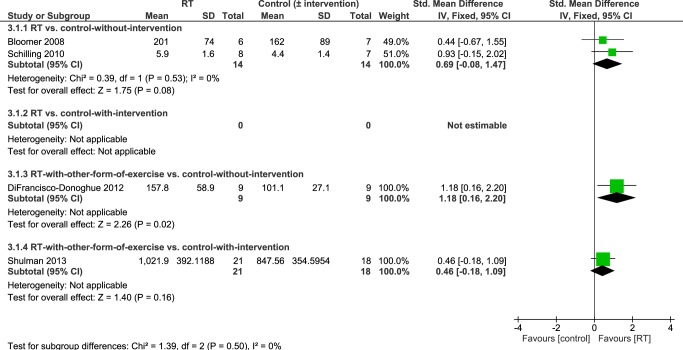
Fig 9. Subgroup analysis forest plot of comparison: RT vs. control-without-intervention, RT vs. control-with-intervention, RT with other form of exercise vs. control-without-intervention, RT with other form of exercise vs. control-with-intervention, using post-intervention values.
Outcome: leg press strength. CI = confidence interval; IV = inverse variance; SMD = standardized mean difference.

