
Figure 4.
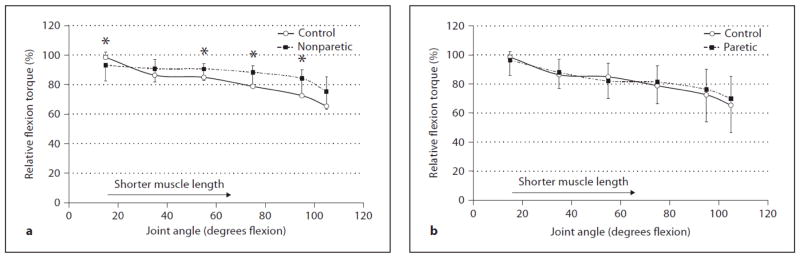
Comparison of relative knee flexion torques (%) between (a) the control group and nonparetic stroke side and (b) control group and paretic stroke side at 6 different angles. The error bars represent 1 SD. * Nonparetic relative torque significantly different than control (p ≤ .05).