
Figure 6.
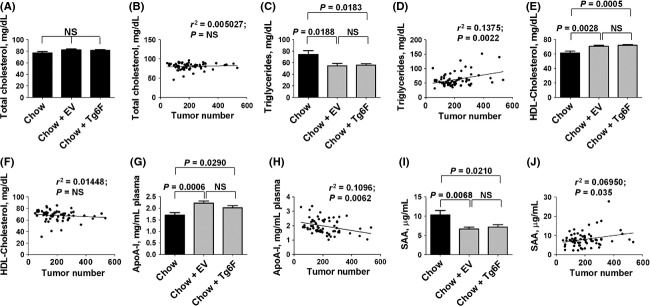
Plasma lipids and plasma serum amyloid A (SAA) levels in mice after intraperitoneal injection of ovarian cancer cells. Plasma lipid levels and SAA levels were measured in the mice described in Figure5. (A) Plasma total cholesterol levels. (B) The linear correlation between plasma total cholesterol levels and the total number of tumors in the abdomen. (C) Plasma triglyceride levels. (D) The linear correlation between plasma triglyceride levels and the total number of tumors in the abdomen. (E) Plasma HDL-cholesterol levels. (F) The linear correlation between plasma HDL-cholesterol levels and the total number of tumors in the abdomen. (G) Plasma apoA-I levels. (H) The linear correlation between plasma apoA-I levels and the total number of tumors in the abdomen. (I) plasma serum amyloid A (SAA) levels. (J) The linear correlation between plasma SAA levels and the total number of tumors in the abdomen. The data shown in the bar graphs are mean ± SEM; NS, not significant. This experiment was done once.