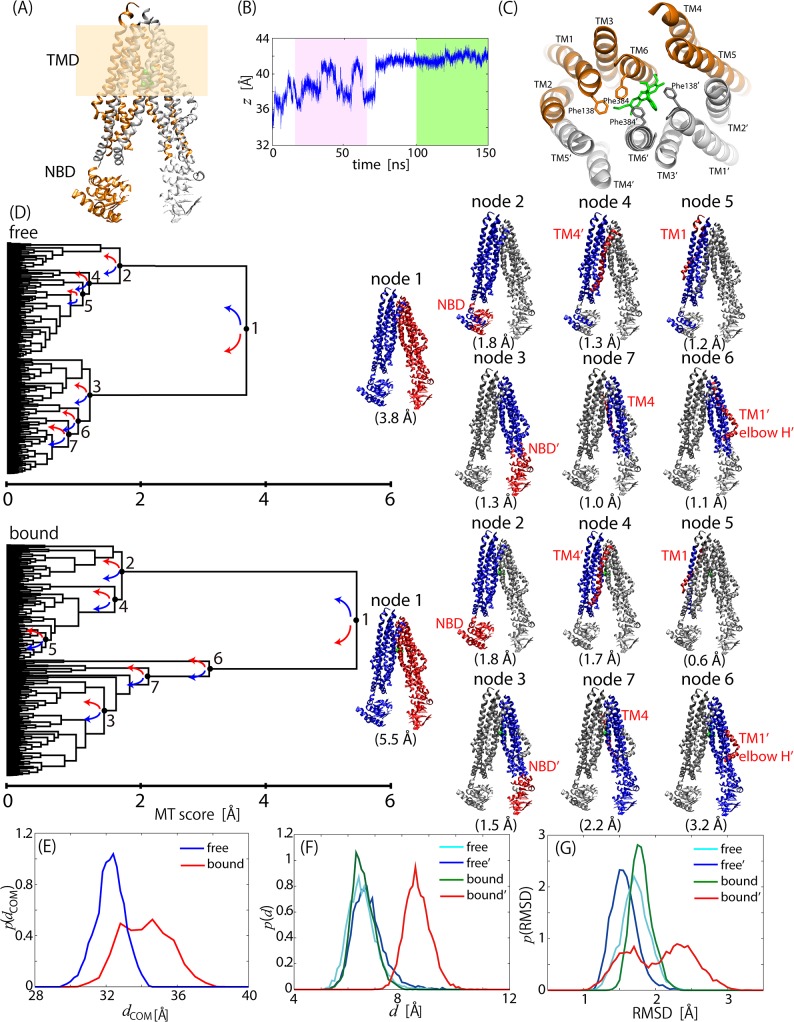
Fig 3. Motion Trees for drug-free and-bound CmABCB1.
(A) Structure of CmABCB1. Two dimer chains are in orange and gray. Each of right and left subunits consists of TMD and NBD, where membrane spanning regions are colored in light brown. (B) Migration of rhodamine 6G center-of-mass along z-axis in 150-ns drug-bound simulation. Green and pink boxes correspond to simulation time ranges used for calculating Motion Trees in Fig 3D and Panel B in S3 Fig (C) Stable binding site including rhodamine 6G (cyan) and two phenylalanine side-chains of 138' and 384'. Colors of two dimer chains are same as those in (A). (D) Motion Trees calculated from last 50-ns trajectory of drug-free and-bound states. Nodes and corresponding structures are indicated with same colors, blue for larger and red for smaller portions. (E) Probability distribution of distance between center-of-masses of two subunits for drug-free (blue) and drug-bound (red) states. (F) Probability distribution of distance between center-of-masses of aromatic rings of Phe138 and Phe384 for left (cyan) and right (blue) subunits of the drug-free state, and for left (green) and right (red) subunits of the drug-bound state. (G) Probability distribution of RMSD for elbow-helix/TM1 relative to other TMD region from the crystal structure of the free form. Color scheme is same as that in (F).

