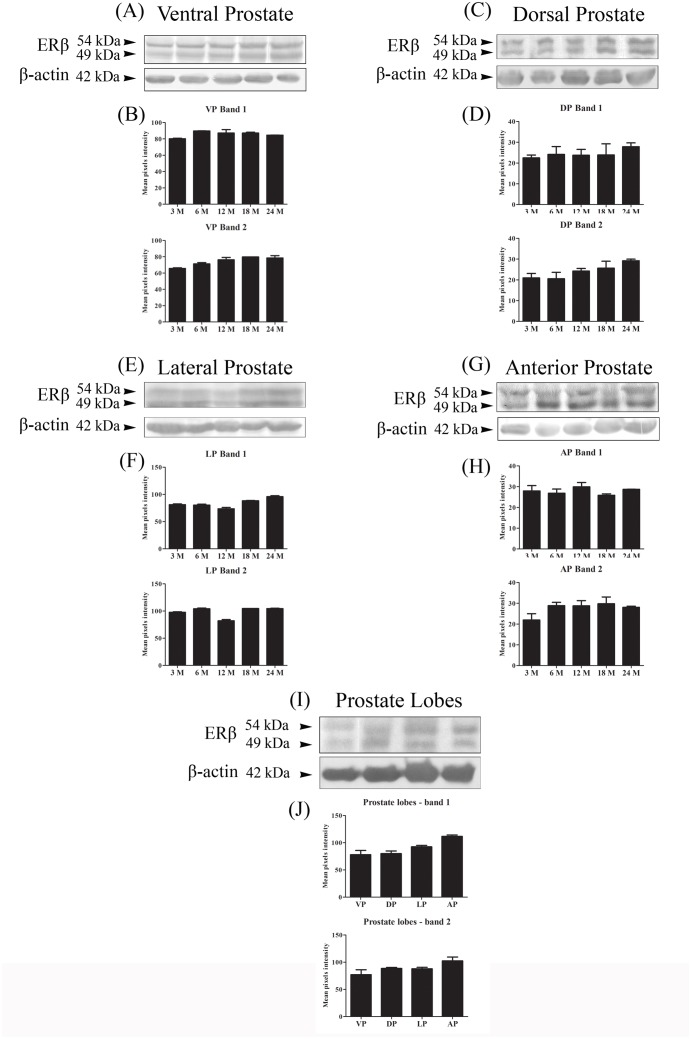
Fig 4. Western blotting of ERβ in the rat prostates at different ages.
(A, C, E and G) Representative bands from the assay. β-actin was used as a reference. (B, D, F and H) Graphical representation of the band densitometric analysis. The data shown are representative of two to three different assays. VP = ventral prostate; DP = dorsal prostate; LP = lateral prostate and AP = anterior prostate. n = 5 per group.

