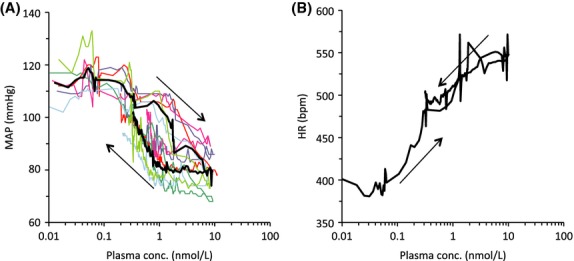
Figure 11.

Tachycardia and hypotension are observed at increasing concentrations of compound 2 in conscious rats. The effects of four consecutive 15-min intravenous infusions of compound 2 on MAP (A) and HR (B). Plasma concentrations were simulated based on modeling of observed PK data. Individual data are shown with thin coloured lines (A) and mean data (n = 6) are shown with a thick black line (both A and B). Arrows denote time order of measurements.
