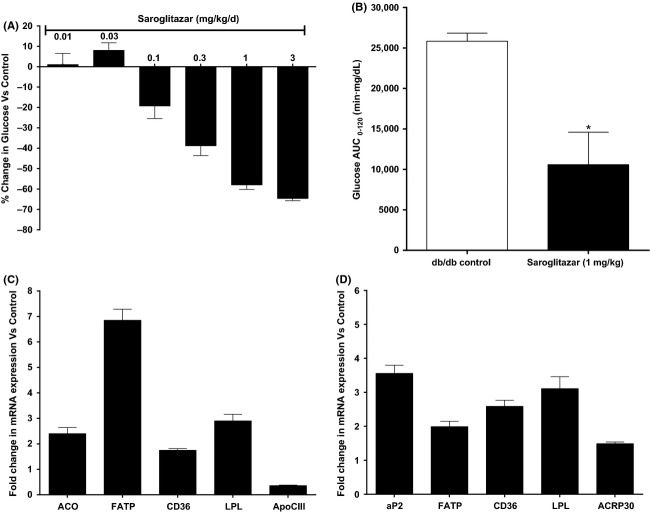
Figure 2.
Effect of Saroglitazar on (A) serum glucose and (B) AUC-glucose in oral glucose tolerance test in db/db mice treated for 12 days. Serum glucose was measured on pretreatment and on day 12 1 h post dose and on day 13 overnight fasted animals were subjected to oral glucose tolerance test with glucose load (1.5 g/kg) for AUC-glucose measurement. The values are calculated as percent change versus Control and expressed as mean ± SEM (n = 6). (C and D) Effect of Saroglitazar on expression of mRNA, in liver (C), and in white adipose tissue (D) of db/db mice treated with Saroglitazar for 12 days at 3 mg/kg dose determined by quantitative real-time PCR. The bars represent the fold change in the treatment groups compared with the vehicle control group, mean ± SEM (n = 6). *Indicates significantly different from vehicle-treated control group, P < 0.05 (ANOVA).

