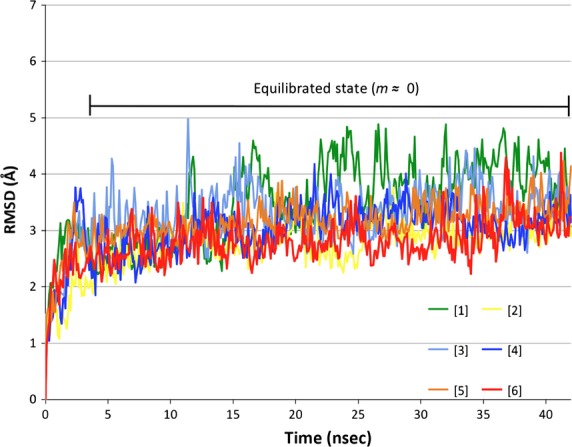
Figure 3.

Root-mean-square deviation of protein α-carbon atoms over 43 nsec of simulation. Data were analyzed following system equilibration (slope (m) ≈ 0, indicated on graph). Green = simulation [1], yellow = simulation [2], light blue = simulation [3], royal blue = simulation [4], orange = simulation [5], red = simulation [6].
