Figure 4.

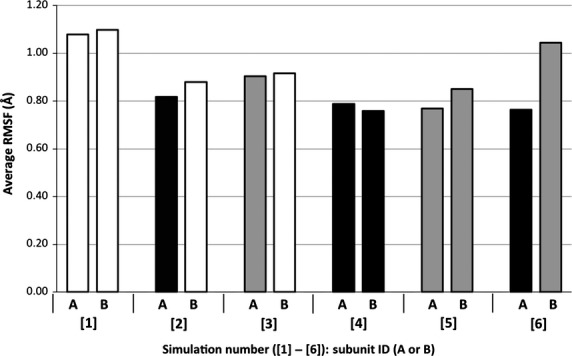
Average α-carbon RMSF values for both hSULT1B1 dimer subunits (A and B). The color of each bar represents binding state of the subunit: White = No cofactor, Black = PAPS, Grey = PAP.

Average α-carbon RMSF values for both hSULT1B1 dimer subunits (A and B). The color of each bar represents binding state of the subunit: White = No cofactor, Black = PAPS, Grey = PAP.