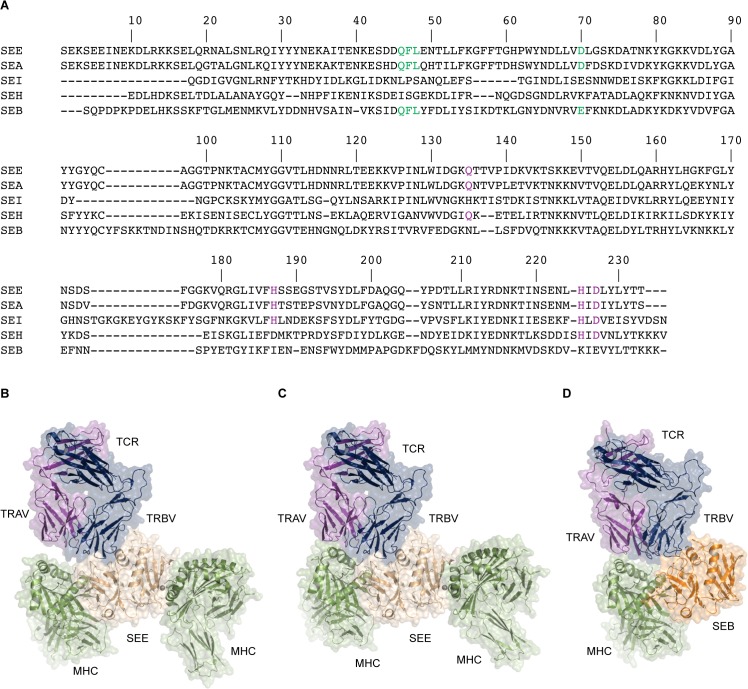
Fig 5. Modelling of the TCR-SEE-(MHC)2 quaternary complex.
(A) Sequence alignment of SEE with SEA, SEB, SEH and SEI, displaying the conservation of both MHC binding sites in SEE, made using ClustalW2 [84, 85]. The N-terminal binding site to the MHC α-chain is marked in green and the C-terminal binding site to the MHC β-chain is marked in purple. (B) The initial model of TCR-SEE-(MHC)2. The TCR is shown in purple and blue (TCRα and TCRβ respectively), the SEE in beige, and MHC molecules in green. (C) The final model of TCR-SEE-(MHC)2. (D) The TCR-SEB-MHC structure, with SEB shown in orange.

