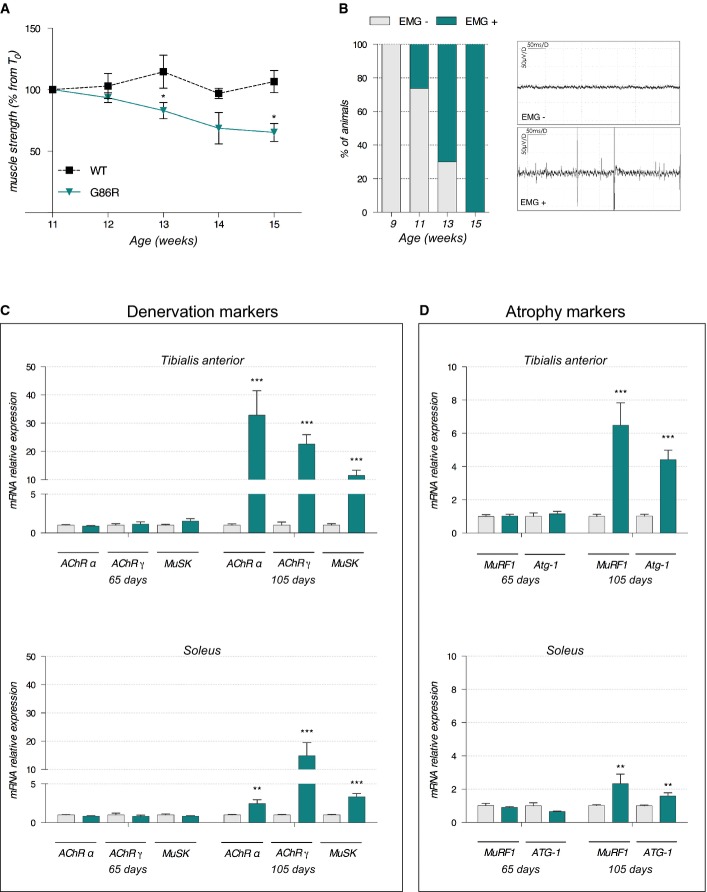
Decreased grip strength, increased denervation, and increased expression of denervation and atrophy markers throughout disease progression in SOD1
Grip test was performed to measure mouse muscle strength at different time points during disease progression. Graph represents the mean of percentage from initial force measured at 11 weeks ± SEM. At 13 weeks, *P = 0.03; at 14 weeks, P = 0.06; at 15 weeks, *P = 0.04 (n = 8 for WT and SOD1G86R, respectively, at 11–15 weeks, two-way ANOVA followed by Fisher's LSD post hoc test).
Electromyography (EMG) recordings were performed weekly during disease development, starting from 9 weeks of age. Spontaneous electrical activity was considered as positive EMG only for peak-to-peak amplitudes > 50 μV. Left: The percentage of mice presenting with positive EMG in each age group are represented. Right: Representative examples of negative (EMG−) and positive (EMG+) electromyography profiles (n = 10 for WT and SOD1G86R, respectively, at 9–13 weeks and n = 8 and 7 for WT and SOD1G86R, respectively, at 15 weeks).
Relative mRNA levels of denervation markers AChR (subunits α and γ) and MuSK were evaluated by qPCR at the indicated ages (65 and 105 days) in tibialis anterior (upper panels) and soleus (lower panels) of WT and SOD1G86R mice. Graphs represent mean fold change ± SEM from age-matched WT (n > 5). ***P-values versus WT: < 0.0001 for AChRα, AChRγ, and MuSK in tibialis anterior; and **P-values versus WT: 0.001 for AChRα, and ***P-values versus WT: 0.0007 for AChRγ, 0.0002 for MuSK in soleus (n=7 and 8 for WT and SOD1G86R, respectively, at 65 days; n = 5 and 6 for WT and SOD1G86R, respectively, at 105 days; two-way ANOVA followed by Fisher's LSD post hoc test).
Relative mRNA levels of muscle atrophy markers MuRF1 and Atg-1 were measured by qPCR at the indicated ages (65 and 105 days) in tibialis anterior (upper panels) and soleus (lower panels). Graphs represent mean fold change ± SEM from age-matched WT. ***P-values versus WT: < 0.0001 for MuRF1 and Atg-1 in tibialis anterior; and **P-values versus WT: 0.007 for MuRF1 and P = 0.006 for Atg-1 in soleus (n = 7 and 8 for WT and SOD1G86R, respectively, at 65 days, n = 5 and 6 for WT and SOD1G86R, respectively, at 105 days, two-way ANOVA followed by Fisher's LSD post hoc test).

