
Figure 3.
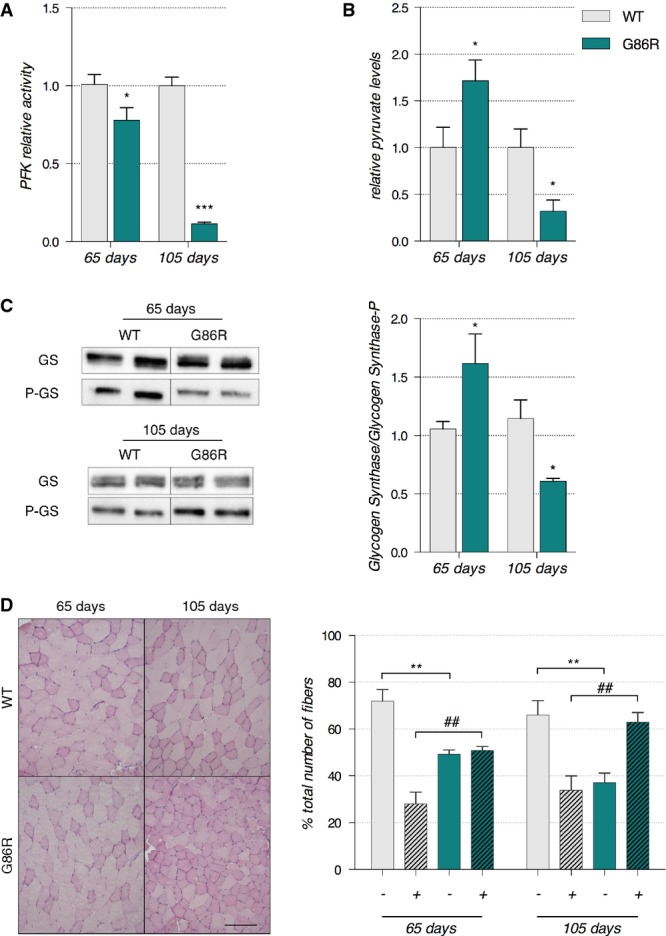
Phosphofructokinase 1 is inhibited in glycolytic muscle and glucose is rerouted toward glycogen stores
- Enzymatic activity of phosphofructokinase in whole tibialis anterior muscle cytosolic homogenates is expressed as mean fold change ± SEM from age-matched WT at 65 days of age *P = 0.016 (WT n = 6, SOD1G86R n = 7) and 105 days of age ***P < 0.0001 (n = 5/genotype), two-way ANOVA followed by Fisher's LSD post hoc test. Data shown are representative of two independent experiments having similar results.
- Pyruvate was measured in whole tibialis anterior muscle tissue homogenates. The mean fold change ± SEM compared to age-matched WT are represented with *P = 0.019 at 65 days of age (n = 5/genotype) and *P = 0.041 at 105 days of age (n = 4/genotype), two-way ANOVA followed by Fisher's LSD post hoc test. Data shown are representative of two independent experiments having similar results.
- Left: Representative Western blot showing glycogen synthase and phosphorylated glycogen synthase levels. Right: Quantification represents the mean ratio of optical densities of glycogen synthase/P-glycogen synthase ± SEM. At 65 days of age n = 6/genotype, *P = 0.0162, and at 105 days of age n = 5/genotype, *P = 0.0163, two-way ANOVA followed by Fisher's LSD post hoc test.
- Left: Representative microphotographs of PAS staining from WT and SOD1G86R tibialis anterior cross-sections at 65 and 105 days of age showing glycogen-negative (light pink) and glycogen-positive (dark pink) fibers. Scale bar: 200 μm. Right: Quantification of glycogen-negative (−) and glycogen-positive (+) fibers at 65 and 105 days of age. For (−) fibers: **P-values versus WT: 0.0026 at 65 days and 0.0074 at 105 days, for (+) fibers: ##P-values versus WT: 0.0025 at 65 days and 0.0073 at 105 days (n = 5/genotype at 65 days and n = 4/genotype at 105 days, two-way ANOVA followed by Fisher's LSD post hoc test).