
Figure 7.
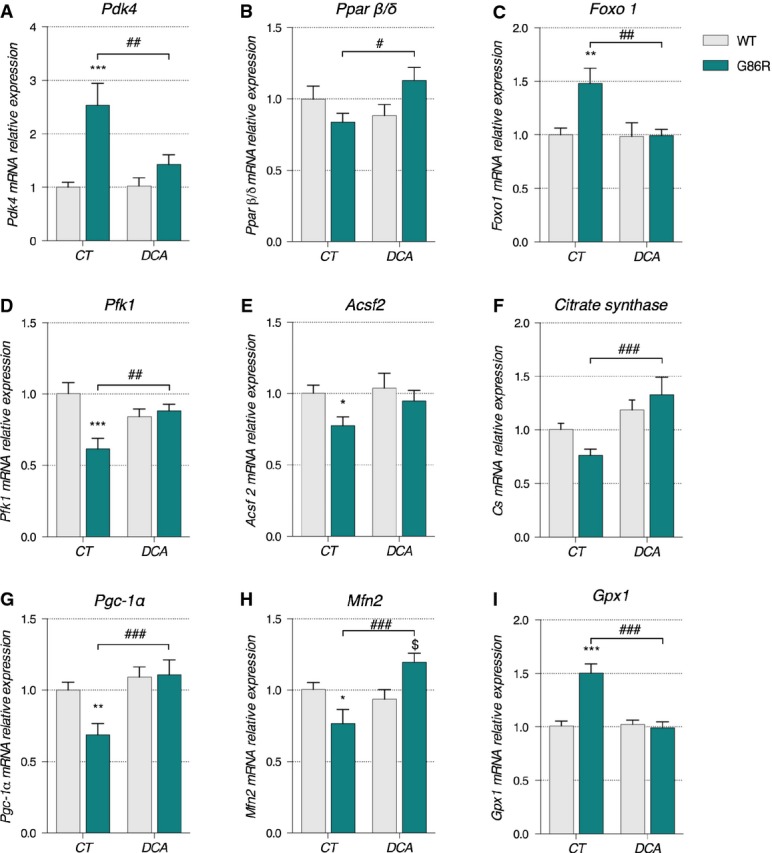
DCA treatment had beneficial effects on metabolism and mitochondrial function of SOD1G86R mice
- A–I Relative mRNA levels of (A) Pdk4, (B) Pparβ/δ, (C) Foxo1, (D) Pfk1, (E) Acsf2, (F) citrate synthase, (G) PGC-1α, (H) Mfn2, and (I) Gpx1 were evaluated by qPCR in tibialis anterior of control (CT) or DCA-treated (DCA) WT and SOD1G86R mice. Graphs represent mean fold change ± SEM from CT WT group. P-values versus WT: Pdk4 ***P = 0.002 and ##P = 0.0039, Pparβ/δ #P = 0.0178, Foxo1 **P = 0.0033 and ##P = 0.0038, Pfk1 ***P = 0.0002 and ##P = 0.0080, Acsf2 *P = 0.0437, citrate synthase ###P = 0.0004, Pgc-1α **P = 0.0084 and ###P = 0.0009, Mfn2 *P = 0.0272, $P = 0.0145 and ###P = 0.0002 and Gpx1 ***P < 0.0001 and ###P < 0.0001 (n = 9/genotype in CT groups, n = 9 and 8 for WT and SOD1G86R, respectively, in DCA group, two-way ANOVA followed by Fisher's LSD post hoc test).