
Figure 8.
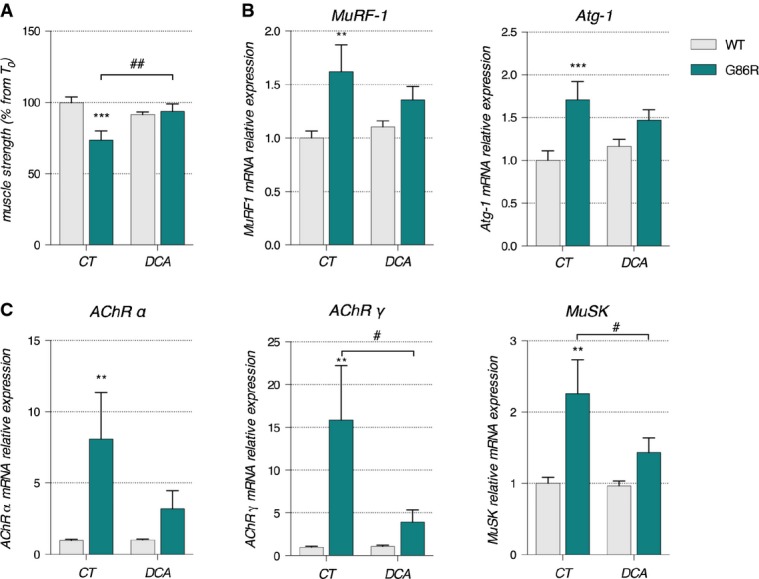
DCA treatment had protective effects on muscle strength and prevented the expression denervation markers
- Grip strength is represented as mean of percent from T0 for each experimental group ± SEM. ##P = 0.0045 and ***P = 0.0003 (n = 9/genotype in CT groups, n = 9 and 8 for WT and SOD1G86R, respectively, in DCA group, two-way ANOVA followed by Fisher's LSD post hoc test).
- Relative mRNA levels of muscular atrophy markers Murf1 and Atg-1 were measured by qPCR in tibialis anterior of control (CT) or DCA-treated (DCA) WT and SOD1G86R mice. Graphs represent mean fold change ± SEM from CT WT group. **P = 0.0079 and ***P = 0.0018 (n = 9/genotype in CT groups, n = 9 and 8 for WT and SOD1G86R, respectively, in DCA group, two-way ANOVA followed by Fisher's LSD post hoc test).
- Relative mRNA levels of denervation markers AChRα, AChRγ, and MuSK were measured by qPCR in tibialis anterior of control (CT) or DCA-treated (DCA) WT and SOD1G86R mice. Graphs represent mean fold change ± SEM from CT WT group. **P = 0.015 for AChRα, #P = 0.028 and **P = 0.074 for AChRγ, #P = 0.042 and **P = 0.0029 for MuSK (n = 9/genotype in CT groups, n = 9 and 8 for WT and SOD1G86R, respectively, in DCA group, two-way ANOVA followed by Fisher's LSD post hoc test).