Figure 1.
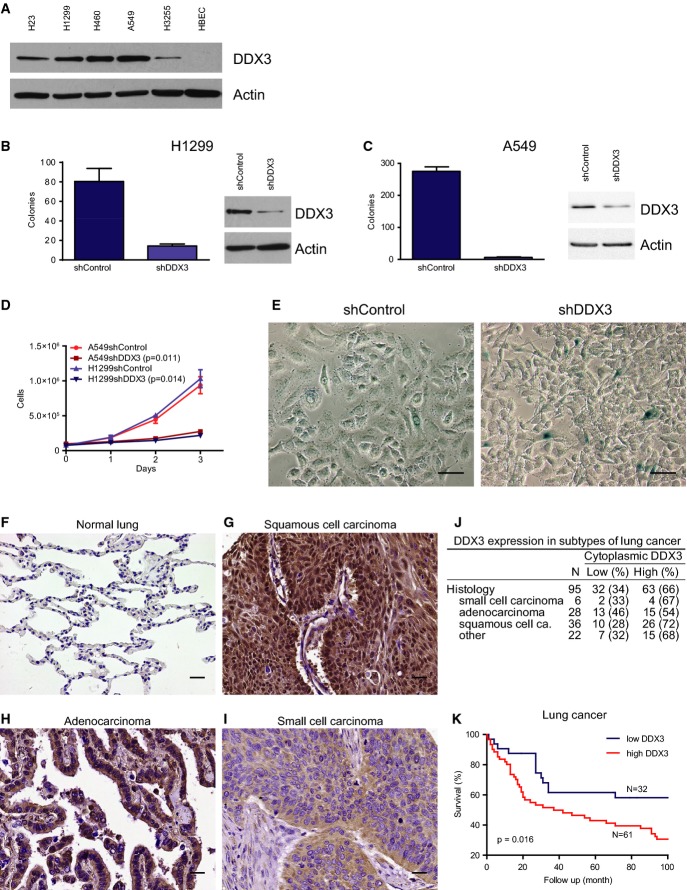
- A Immunoblot of DDX3 expression in lung cancer cell lines.
- B, C Colony-forming assays in H1299 (B) and A549 (C) lung cancer cells after knockdown by shRNA lentiviral constructs designed against DDX3 or vector control. Corresponding immunoblots displaying knockdown levels of DDX3. Mean from 3 replicates with SD.
- D Proliferation of A549 and H1299 cells after knockdown of DDX3. Mean from 3 replicates with SD. (A549 P = 0.011, H1299 P = 0.014; exponential curve fit, extra sum of squares F-test).
- E β-galactosidase staining in parental A549 cells and A549 DDX3 knockdown cells displaying senescent cells identified by the blue color.
- F Expression of DDX3 by immunohistochemistry in normal lung tissue.
- G DDX3 expression in squamous cell carcinoma.
- H DDX3 expression in adenocarcinoma.
- I DDX3 expression in small cell carcinoma.
- J Expression of DDX3 in different histological types of lung cancer. All data sets were compared against each other (chi-square test, P = 0.481).
- K Survival analysis of lung cancer patients in low and high DDX3 expressing tumors (Kaplan–Meier curve and log-rank test, P = 0.016).
Data information: Scale bars: 25 μm.
Source data are available online for this figure.

