Figure 3.
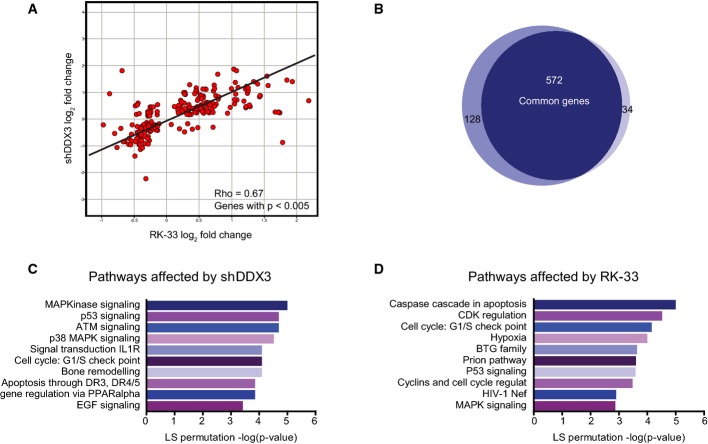
- A Scatter plot of the gene expression log2 fold change in DDX3 knockdown and RK-33-treated MDA-MB-231 cells. Each red dot represents a gene, which was significantly perturbed after treatment with RK-33 and after knockdown of DDX3.
- B The Venn diagram depicts the number of common genes dysregulated by both shDDX3 and RK-33 treatments.
- C, D BioCarta pathway analysis of gene expression in DDX3 knockdown and RK-33-treated cells. Pathways are ranked on LS permutation P-values from top to bottom.

