Figure 4.
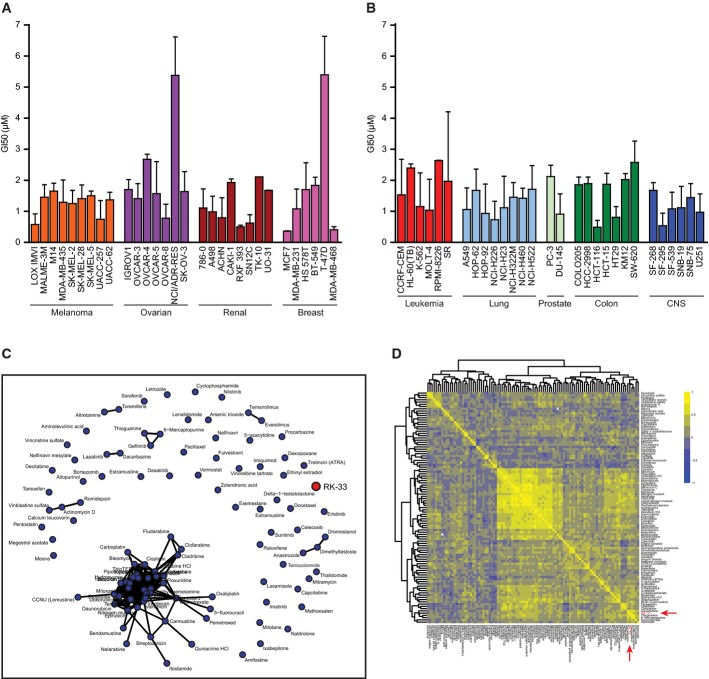
- A, B The graph depicts the growth inhibitory properties (GI50) of RK-33 for the NCI-60 panel of cell lines. The NCI-60 is a panel of 60 extensively characterized human cell lines derived from nine distinct tumor types: melanoma, ovarian, renal, breast, leukemia, lung, prostate, colon, and CNS.
- C Network analysis of 102 FDA-approved drugs and RK-33 based on GI50 in the NCI-60 cell line panel.
- D Unsupervised cluster analysis of the 102 FDA-approved drugs based on the correlation structure of the GI50 levels. The result is shown as a symmetric heat map with positive associations depicted in yellow and negative associations shown in blue.
Data information: Error bars represent SD and all experiments were done in replicates.

