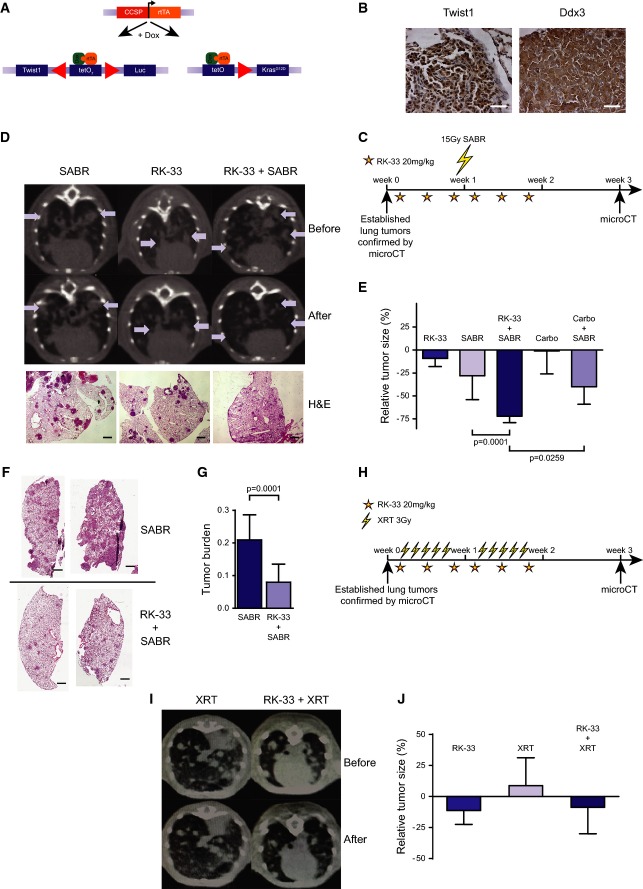
Schematic describing the Twist1/KrasG12D-inducible mouse model.
Confirmation of high expression of Twist1 and DDX3 in the lung tumors of the transgenic Twist1/KrasG12D mouse. Scale bar is 100 μm.
Treatment schedule for mice receiving hypofractionated radiation (SABR). Stars are intraperitoneal (i.p.) injections with RK-33.
Micro-CT images of transgenic Twist1/KrasG12D mice treated as in (C), before treatment and 1 week after treatment. Tumors are indicated by arrows and confirmed by H&E staining of lung sections (lower panel). Scale bar is 250 μm.
Quantification of tumor volume measured by micro-CT in Twist1/KrasG12D mice, as shown in (D). Significance was assessed by two-sided, unpaired t-test. Error bars represent SD.
An orthotopic lung tumor model was generated using A549 human lung cancer cells and treated as in (C). Figure displays H&E staining of lung sections from radiation-treated (upper panel) and RK-33- and radiation-treated mice (lower panel). Scale bar is 2 mm.
Quantification of tumor burden (as tumor surface divided by total lung surface) in orthotopic A549 lung cancer mouse model, as shown in (F). Significance was assessed by two-sided, unpaired t-test. Error bars represent SD.
Treatment schedule for mice receiving fractionated radiation in 10 fractions. Stars indicate i.p. injections with RK-33. Downward lightning bolts indicate 3-Gy radiation fractions.
Micro-CT images of transgenic Twist1/KrasG12D mice treated as in (H), before treatment and 1 week after treatment.
Quantification of tumor volume measured by micro-CT in Twist1/KrasG12D mice, as shown in (I) and expressed as relative tumor size. Significance was assessed by two-sided, unpaired t-test. Error bars represent SEM.

