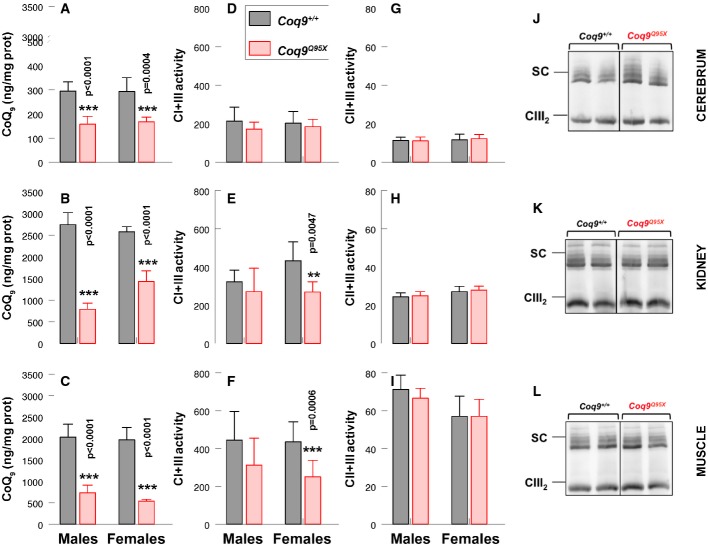
Figure 6.
- A–C Mitochondrial CoQ9 levels from cerebrum (A), kidney (B) and skeletal muscle (C) of Coq9+/+ and Coq9Q95X males and females. n = 8 for each group.
- D–F CI+CIII activity in cerebrum (D), kidney (E) and skeletal muscle (F) of male and female Coq9+/+ and Coq9Q95X mice. n = 6 for each group.
- G–I CII+CIII activity in cerebrum (G), kidney (H) and skeletal muscle (I) of male and female Coq9+/+ and Coq9Q95X mice. n = 6 for each group.
- J–L Blue-native gel electrophoresis (BNGE) followed by immunoblotting analysis of mitochondrial supercomplexes from Coq9+/+ (n = 3) and Coq9Q95X mice (n = 4) at 3 months of age.
Data information: (A–I) Data are expressed as mean ± SD. Statistical analyses were performed on Coq9+/+ male mice versus Coq9Q95X male mice and Coq9+/+ female mice versus Coq9Q95X female mice. **P < 0.01; ***P < 0.001. Student's t-test. Complex I+III, NADH-cytochrome c reductase; complex II+III, SDH-cytochrome c reductase.
Source data are available online for this figure.

