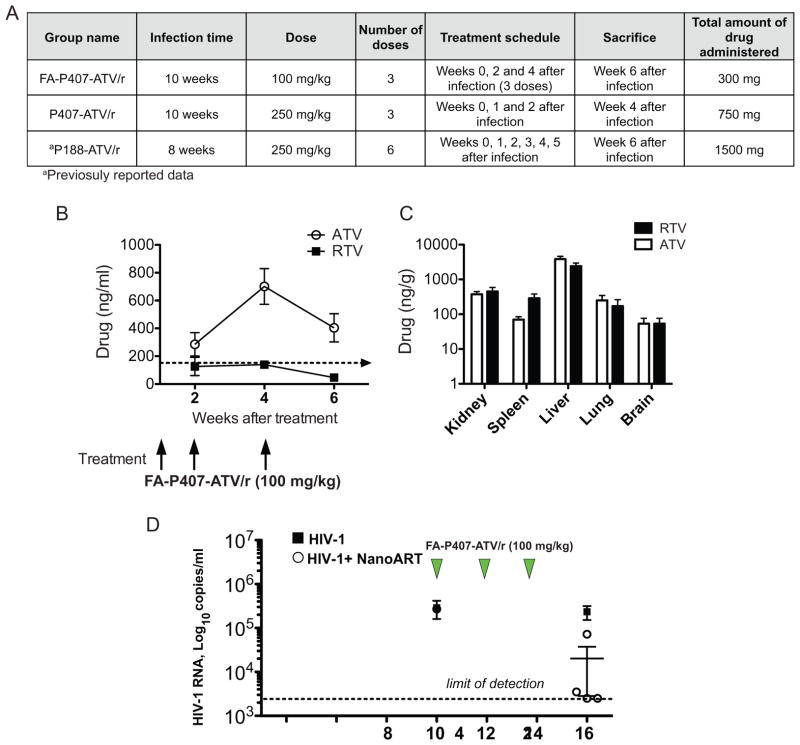
Figure 1.
Comparison of pharmacokinetics and viral loads between targeted and untargeted nanoformulations in CD34+ hematopoietic stem cell transplanted humanized NOD/scid-IL-2Rγcnull mice (A) Table describing the infection and treatment scheme in FA-P407-ATV/r and untargeted groups. Pharmacokinetics of FA-P407-ATV/r. FA-P407-ATV/r (100 mg/kg) was administered after the mice were infected for 10 weeks. A boosting dose of 100 mg/kg was again administered 2 and 4 weeks following the initial dose. Plasma was collected at indicated time points. (B) ATV (open circle) and RTV (closed box) concentrations in plasma were determined by UPLC-MS/MS. Tissues were collected 6 weeks following the initial dose. Data are expressed, as mean ± SEM. (n=5) (C) Tissue ATV and RTV concentrations were determined by UPLC–MS/MS. All data are expressed as mean ± SEM. (n≥3) (D) Plasma viral load in CD34+-HSC-NSG mice during and following FA-P407-ATV/r treatment. Humanized NSG mice were either treated with 3 doses of 100 mg/kg FA-P407-ATV/r at 10, 12 and 14 weeks following HIV-1 infection or untreated. Plasma viral loads from FA-P407-ATV/r (open circle) and untreated (Closed boxes) groups were determined before and after treatment as illustrated. Data are expressed, as mean ± SEM. Data are statistically significant at P <0.05 with Mann-Whitney test (n≥4).

