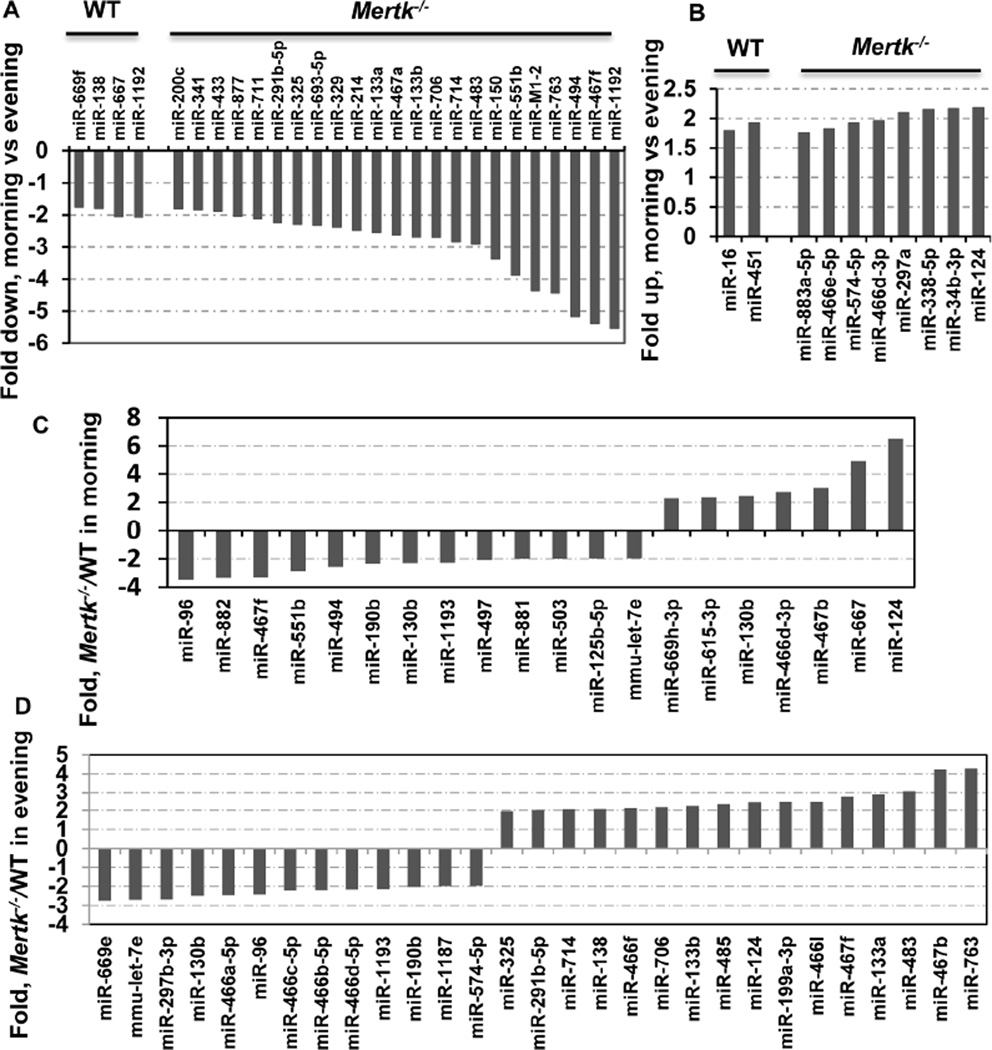
Figure 2. MiRNAs regulation during the diurnal lighting cycle. (A and B).
Comparison of miRNA expression between the morning and evening groups. MiRNAs expression levels are normalized to U6 internal control and plotted as fold changes in the miRNA level expressed in the morning as compared to the level in the evening. More miRNAs in the Mertk−/− RPE was differentially expressed between the morning and evening groups (A, B, right). Data are expressed as the average of two independent experiments. Only changes ≥ ±1.8-fold are shown. (C and D) Comparison of miRNA expression between the Mertk−/− and WT groups. Expressions of miRNAs are normalized to U6 internal controls and plotted as fold-changes for Mertk−/− over the WT controls. The comparison was performed between the morning (C) and the evening (D) groups. Data are expressed as the average of two independent experiments. Fold changes with ≥ ±2.0-fold are shown.

