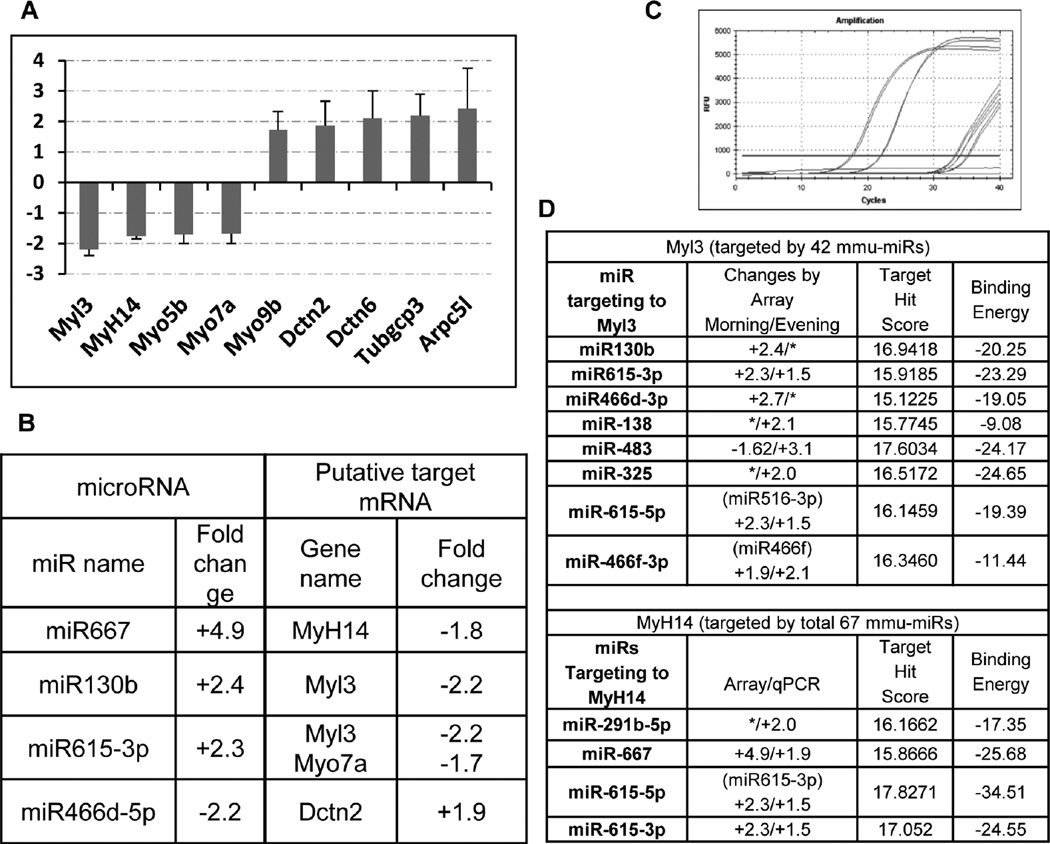
Figure 4. Changes of the putative target genes are correlative with the regulation of miRNAs.
(A) The expression level of selected putative target genes was measured by real-time PCR and normalized to S18 RNA internal control and plotted as fold changes in the Mertk−/− vs. WT RPE cells prepared at 2 hr after the onset of light. Data are expressed as mean of triplicate samples ±SD. Only changes ≥ ±1.5-fold are shown. (B) Shows correlative changes of putative target mRNA with the regulatory miRNAs, § represents data obtained from the morning group. (C) Shows the amplification plot of Myl3 qPCR amplification. Based on the microarray data as shown in Table 1 or Figures 3 and 4 (D) lists all the up-regulated miRNAs (or their precursors) that are predicted to bind to either Mhyl3 or Myh14, along with the calculated target hit score and binding energy. [*] represent fold changes by <± 1.5.

