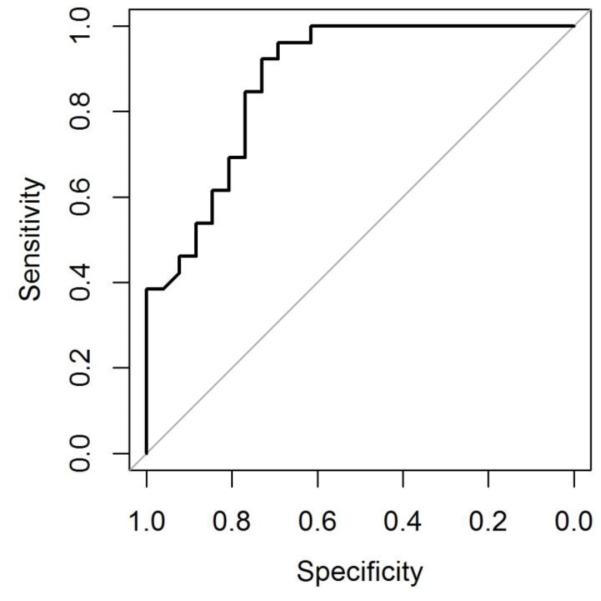
Figure 3.
Receiver-operator characteristic (ROC) curve visualizing the tradeoff between sensitivity and specificity of optic nerve lesion length demonstrated good accuracy defined by the area under the curve. The point on the curve closest to perfect (coordinate 1,1) is 17.6 mm that correlates with a sensitivity of 80.8%, a specificity of 76.9% and a likelihood ratio of 3.50.

