Figure 2.

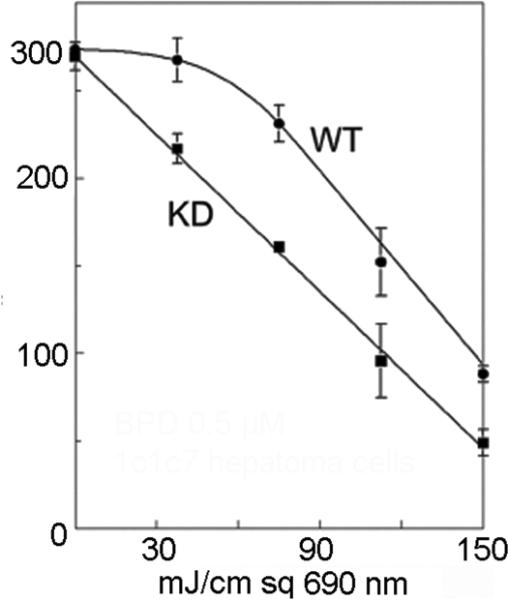
PDT dose-response curves for wild-type 1c1c7 cells and an ATG7 knockdown. This illustrates the cytoprotective effect of autophagy. The ‘shoulder’ on the dose-response curve is lost when autophagy is suppressed.

PDT dose-response curves for wild-type 1c1c7 cells and an ATG7 knockdown. This illustrates the cytoprotective effect of autophagy. The ‘shoulder’ on the dose-response curve is lost when autophagy is suppressed.