
Figure 2.
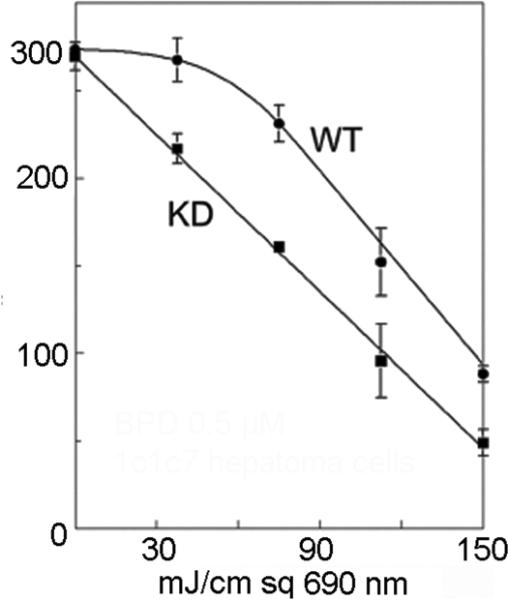
PDT dose-response curves for wild-type 1c1c7 cells and an ATG7 knockdown. This illustrates the cytoprotective effect of autophagy. The ‘shoulder’ on the dose-response curve is lost when autophagy is suppressed.
Official websites use .gov
A
.gov website belongs to an official
government organization in the United States.
Secure .gov websites use HTTPS
A lock (
) or https:// means you've safely
connected to the .gov website. Share sensitive
information only on official, secure websites.
PDT dose-response curves for wild-type 1c1c7 cells and an ATG7 knockdown. This illustrates the cytoprotective effect of autophagy. The ‘shoulder’ on the dose-response curve is lost when autophagy is suppressed.