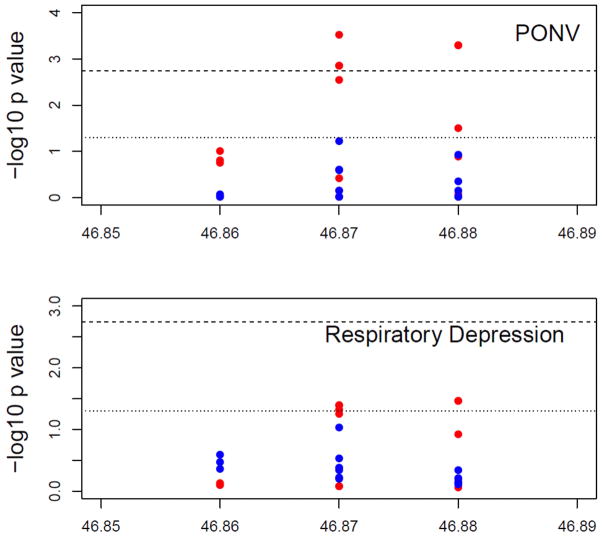
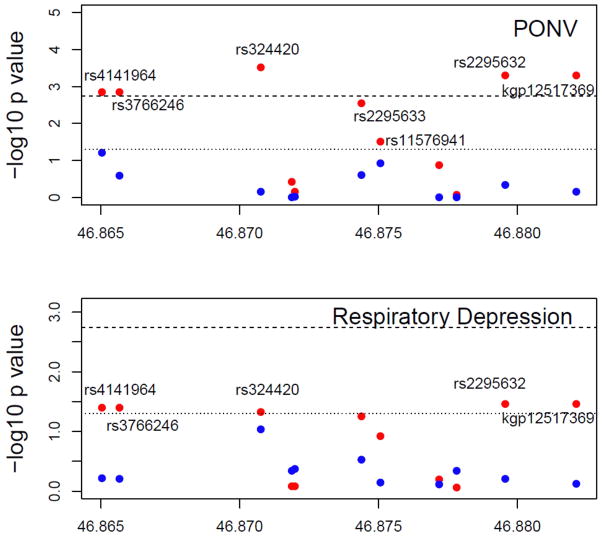
Figure 2. FAAH genotypes associated with Respiratory Depression, PONV and Morphine requirement.
Figure 2a. They axis shows the −log10 P values and the x axis shows the chromosomal positions of the FAAH SNPs. Results are shown for whites (red dots) and blacks (blue dots) separately. P values of the genetic association of the 39 FAAH SNPs with PONV (top) and RD (bottom). The reference lines represent the thresholds of p=0.0018 (shot dash line) and p=0.05 (dotted line), respectively. PACU = Post Anesthesia Care Unit; RD = respiratory depression; PONV = Postoperative Nausea and Vomiting; FAAH = Fatty Acid Amide Hydrolase.
Figure 2b. The y axis shows the −log10 P values and the x axis shows the chromosomal positions of the of the 11 FAAH SNPs between 46.86 to 46.89 Mb of Chromosome 1 with PONV (top panel) and RD (bottom panel). Results are shown for whites (red dots) and blacks (blue dots) separately. The reference lines represent the thresholds of p=0.0018 (shot dash line) and p=0.05 (dotted line), respectively. PACU = Post Anesthesia Care Unit; RD = respiratory depression; PONV = Postoperative Nausea and Vomiting; FAAH = Fatty Acid Amide Hydrolase.


