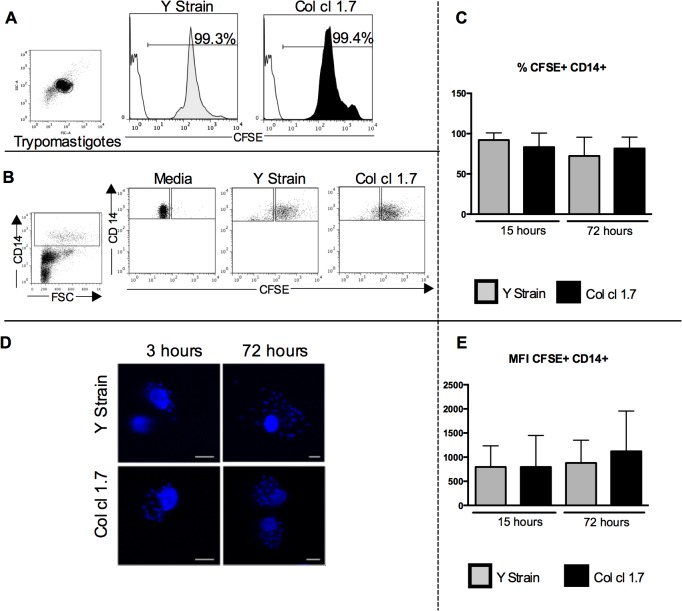
Fig 1. Evaluation of the frequency and intensity of T. cruzi infection in human monocytes.
Results are expressed as average ± standard deviation. The symbol * indicates p < 0.05 between groups. Trypomastigotes from Y strain and Col cl1.7 were previously stained with CFSE and used for infections for 15 and 72 hours. (A) Representative figure of CFSE staining on trypomastigotes of Y strain and Col cl1.7. The plot shows the population of trypomastigotes; the white peaks in the histograms represent isotype control and the gray and black peaks represent Y and Col cl1.7 strains, respectively. (B) Representative figure of gating strategy for defining the CFSE+ and CFSE- in CD14+ cells, showing the first gate considering size (FSC) versus CD14 expression, followed by the gates considering CD14+ and CFSE+ and CFSE-. (C) Frequency of CFSE+ CD14+ cells. (D) Representative confocal microscopy analysis, showing DAPI-stained parasite’s nuclei inside monocytes. Cells were infected with Y strain or Col cl1.7 for 15 or 72 hours with 10 parasites/cell, preparation were stained with DAPI, and read on a confocal microscope, as described in material and methods; magnification x62. (E) Mean intensity of expression of CFSE fluorescence.

