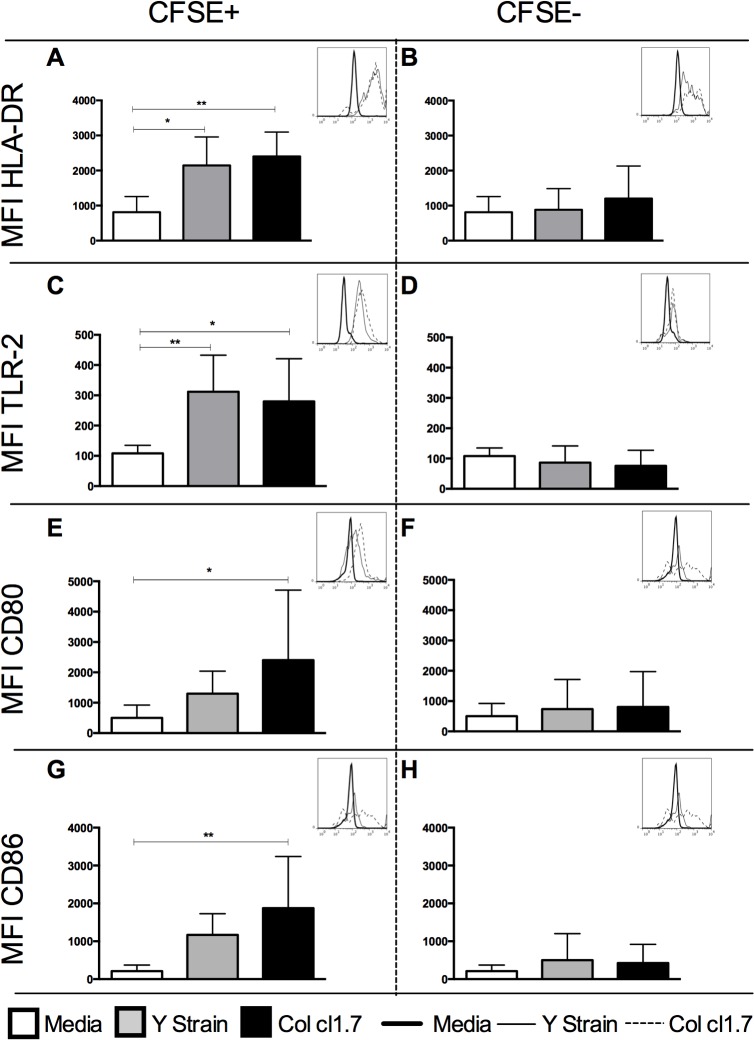
Fig 2. Determination of the MFI of HLA-DR, TLR-2, CD80 and CD86 in human monocytes infected or not with strains of T. cruzi.
Results are expressed as average ± standard deviation. The symbol * indicates p< 0.05 between groups. Determination of mean intensity of (A) HLA-DR in CFSE+ monocytes after 15 hours of culture; (B) HLA-DR in CFSE- monocytes after 15 hours of culture; (C) TLR-2 in CFSE+ monocytes after 15 hours of culture; (D) TLR-2 in CFSE- monocytes after 15 hours of culture; (E) CD80 in CFSE+ monocytes after 72 hours of culture; (F) CD80 in CFSE- monocytes after 72 hours of culture; (G) CD86 in CFSE+ monocytes after 72 hours of culture; (H) CD86 in CFSE- monocytes after 72 hours of culture. Histogram inserts show a representative overlay for the expression of each of the molecules under the different conditions.

