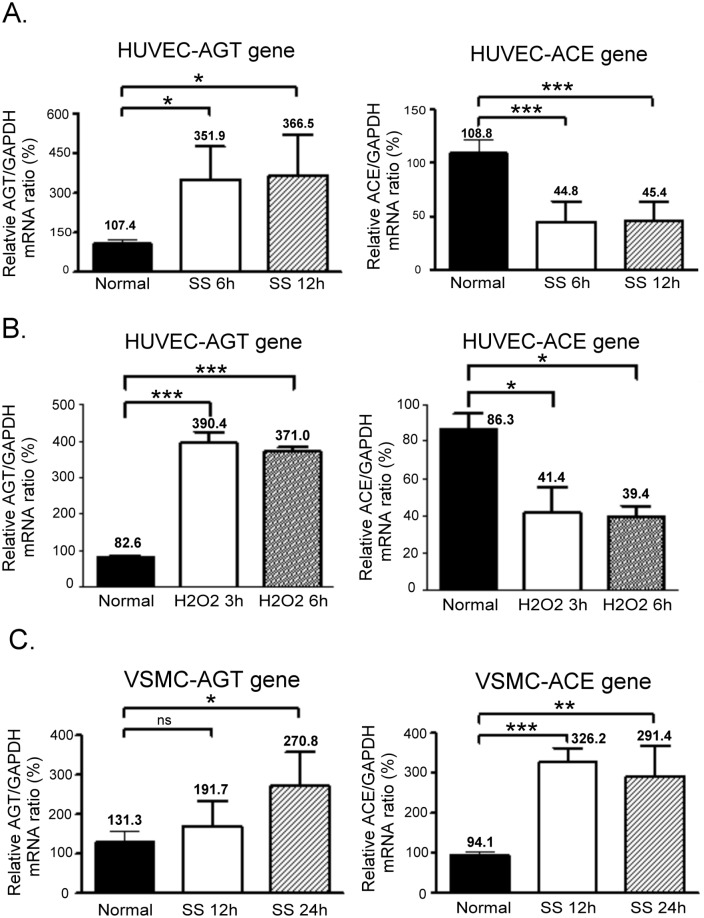
Fig 3. AGT and ACE gene expression in apoptotic HUVECs and VSMCs.
(A) AGT and ACE gene expression in HUVECs that underwent SS for 6 and 12 h. (B) AGT and ACE gene expression in HUVECs exposed to H2O2 for 3 and 6 h. (C) AGT and ACE gene expression in VSMCs that underwent SS for 12 and 24 h. Real-time PCR was performed in the triplicate on each SS-treated sample for both AGT mRNA and ACE mRNA. The relative mRNA ratios represent the respective ΔCt of AGT or ACE normalised according to the ΔCt of GADPH in each experiment. The relative mRNA ratio in the normal medium was designated as 100%. Each assay was repeated 3 times, and the error bars in each individual figure represent the SE. *P < 0.05, **P < 0.01, and ***P < 0.001 in comparison to the control group. ns, no significance.

