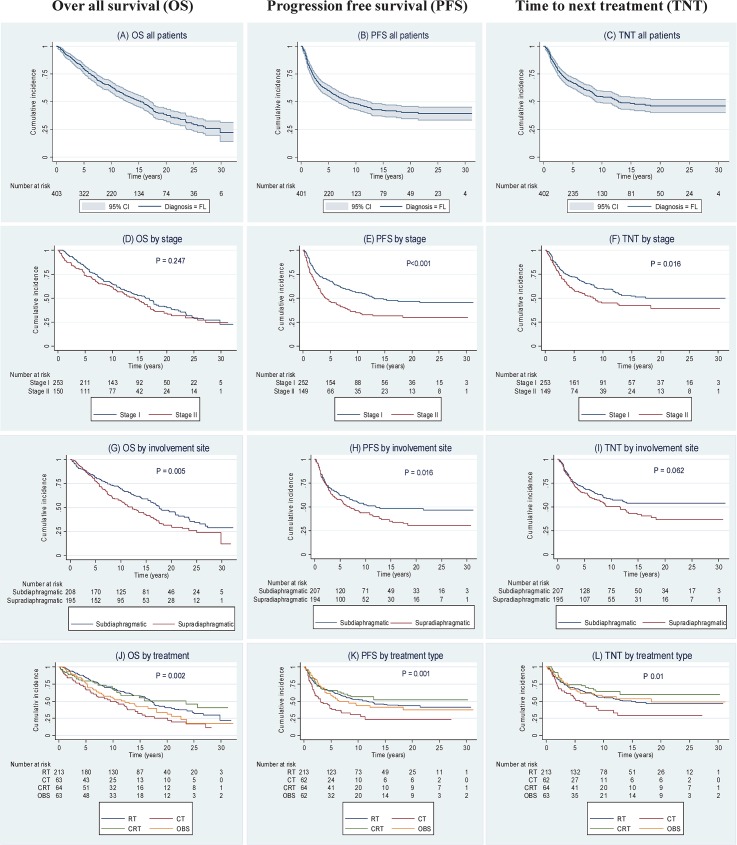
Fig 1. Kaplan-Meier survival curves showing overall survival (OS), progression free survival (PFS) and time to next treatment (TNT).
Survival curves are illustrated as follows: (A) OS for all follicular lymphoma (FL) patients; (B) PFS for all FL patients; (C) TNT for all FL patients; (D) OS by stage; (E) PFS by stage; (F)TNT by stage; (G) OS by involvement site; (H) PFS by involvement site; (I) TNT by involvement site; (J) OS by treatment type; (K) PFS by treatment type; and (L) TNT by treatment type. Note: Pointwise confidence bands are not shown when survival curves overlap or run close to each other. P-values in (D) to (I) are from log-rank tests comparing the two groups, in (J) to (L) from generalized log-rank tests comparing all groups.

